
 Yahoo Finance
 Is E.ON SE (ETR:EOAN) A Strong Dividend Stock?
Is E.ON SE (ETR:EOAN) a good dividend stock? How can we tell? Dividend paying companies with growing earnings can be highly rewarding in the long term. Yet sometimes, investors buy a popular dividend stock because of its yield, and then lose money if the company's dividend doesn't live up to expectations.
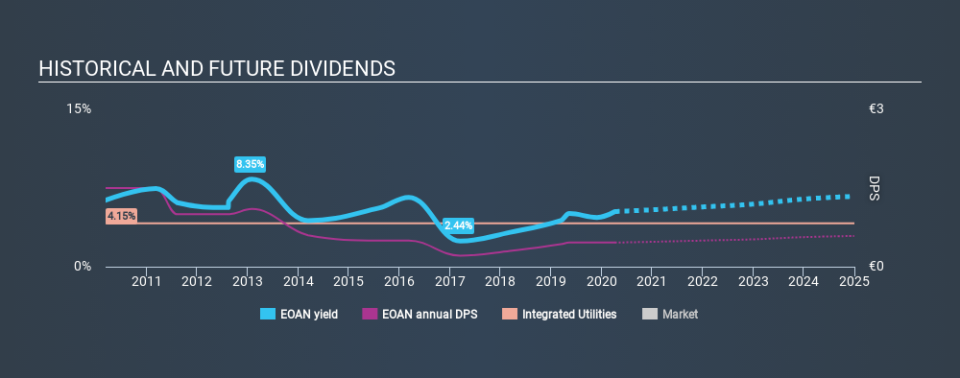
In this case, E.ON likely looks attractive to investors, given its 5.3% dividend yield and a payment history of over ten years. It would not be a surprise to discover that many investors buy it for the dividends. The company also returned around 1.5% of its market capitalisation to shareholders in the form of stock buybacks over the past year. Some simple analysis can reduce the risk of holding E.ON for its dividend, and we'll focus on the most important aspects below.
Click the interactive chart for our full dividend analysis
Payout ratios
Companies (usually) pay dividends out of their earnings. If a company is paying more than it earns, the dividend might have to be cut. As a result, we should always investigate whether a company can afford its dividend, measured as a percentage of a company's net income after tax. In the last year, E.ON paid out 210% of its profit as dividends. A payout ratio above 100% is definitely an item of concern, unless there are some other circumstances that would justify it.
In addition to comparing dividends against profits, we should inspect whether the company generated enough cash to pay its dividend. Last year, E.ON paid a dividend while reporting negative free cash flow. While there may be an explanation, we think this behaviour is generally not sustainable.
Is E.ON's Balance Sheet Risky?
As E.ON's dividend was not well covered by earnings, we need to check its balance sheet for signs of financial distress. A rough way to check this is with these two simple ratios: a) net debt divided by EBITDA (earnings before interest, tax, depreciation and amortisation), and b) net interest cover. Net debt to EBITDA is a measure of a company's total debt. Net interest cover measures the ability to meet interest payments. Essentially we check that a) the company does not have too much debt, and b) that it can afford to pay the interest. E.ON has net debt of 7.88 times its EBITDA, which implies meaningful risk if interest rates rise of earnings decline.
Net interest cover can be calculated by dividing earnings before interest and tax (EBIT) by the company's net interest expense. With EBIT of 2.62 times its interest expense, E.ON's interest cover is starting to look a bit thin. Low interest cover and high debt can create problems right when the investor least needs them, and we're reluctant to rely on the dividend of companies with these traits.
Consider getting our latest analysis on E.ON's financial position here.
Dividend Volatility
Before buying a stock for its income, we want to see if the dividends have been stable in the past, and if the company has a track record of maintaining its dividend. E.ON has been paying dividends for a long time, but for the purpose of this analysis, we only examine the past 10 years of payments. This dividend has been unstable, which we define as having been cut one or more times over this time. During the past ten-year period, the first annual payment was €1.50 in 2010, compared to €0.46 last year. The dividend has fallen 69% over that period.
When a company's per-share dividend falls we question if this reflects poorly on either external business conditions, or the company's capital allocation decisions. Either way, we find it hard to get excited about a company with a declining dividend.
Dividend Growth Potential
Given that dividend payments have been shrinking like a glacier in a warming world, we need to check if there are some bright spots on the horizon. Strong earnings per share (EPS) growth might encourage our interest in the company despite fluctuating dividends, which is why it's great to see E.ON has grown its earnings per share at 34% per annum over the past five years. The company has been growing its EPS at a very rapid rate, while paying out virtually all of its income as dividends. While EPS could grow fast enough to make the dividend sustainable, in this type of situation, we'd want to pay extra attention to any fragilities in the company's balance sheet.
Conclusion
When we look at a dividend stock, we need to form a judgement on whether the dividend will grow, if the company is able to maintain it in a wide range of economic circumstances, and if the dividend payout is sustainable. We're a bit uncomfortable with E.ON paying out a high percentage of both its cashflow and earnings. We were also glad to see it growing earnings, but it was concerning to see the dividend has been cut at least once in the past. With this information in mind, we think E.ON may not be an ideal dividend stock.
Companies possessing a stable dividend policy will likely enjoy greater investor interest than those suffering from a more inconsistent approach. At the same time, there are other factors our readers should be conscious of before pouring capital into a stock. For example, we've identified 6 warning signs for E.ON (1 can't be ignored!) that you should be aware of before investing.
Looking for more high-yielding dividend ideas? Try our curated list of dividend stocks with a yield above 3%.
If you spot an error that warrants correction, please contact the editor at editorial-team@simplywallst.com. This article by Simply Wall St is general in nature. It does not constitute a recommendation to buy or sell any stock, and does not take account of your objectives, or your financial situation. Simply Wall St has no position in the stocks mentioned.
We aim to bring you long-term focused research analysis driven by fundamental data. Note that our analysis may not factor in the latest price-sensitive company announcements or qualitative material. Thank you for reading.
