
 Yahoo Finance
 Earnings Not Telling The Story For Aimflex Berhad (KLSE:AIMFLEX)
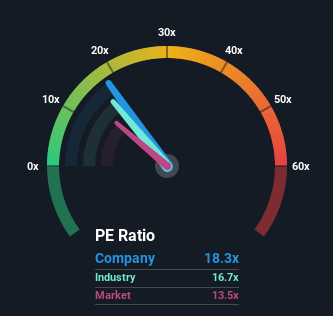
When close to half the companies in Malaysia have price-to-earnings ratios (or "P/E's") below 13x, you may consider Aimflex Berhad (KLSE:AIMFLEX) as a stock to potentially avoid with its 18.3x P/E ratio. Although, it's not wise to just take the P/E at face value as there may be an explanation why it's lofty.
Aimflex Berhad certainly has been doing a great job lately as it's been growing earnings at a really rapid pace. It seems that many are expecting the strong earnings performance to beat most other companies over the coming period, which has increased investors’ willingness to pay up for the stock. You'd really hope so, otherwise you're paying a pretty hefty price for no particular reason.
View our latest analysis for Aimflex Berhad
We don't have analyst forecasts, but you can see how recent trends are setting up the company for the future by checking out our free report on Aimflex Berhad's earnings, revenue and cash flow.
How Is Aimflex Berhad's Growth Trending?
There's an inherent assumption that a company should outperform the market for P/E ratios like Aimflex Berhad's to be considered reasonable.
Taking a look back first, we see that the company grew earnings per share by an impressive 283% last year. The latest three year period has also seen a 17% overall rise in EPS, aided extensively by its short-term performance. Accordingly, shareholders would have probably been satisfied with the medium-term rates of earnings growth.
Comparing that to the market, which is predicted to deliver 9.2% growth in the next 12 months, the company's momentum is weaker based on recent medium-term annualised earnings results.
In light of this, it's alarming that Aimflex Berhad's P/E sits above the majority of other companies. Apparently many investors in the company are way more bullish than recent times would indicate and aren't willing to let go of their stock at any price. Only the boldest would assume these prices are sustainable as a continuation of recent earnings trends is likely to weigh heavily on the share price eventually.
What We Can Learn From Aimflex Berhad's P/E?
We'd say the price-to-earnings ratio's power isn't primarily as a valuation instrument but rather to gauge current investor sentiment and future expectations.
We've established that Aimflex Berhad currently trades on a much higher than expected P/E since its recent three-year growth is lower than the wider market forecast. Right now we are increasingly uncomfortable with the high P/E as this earnings performance isn't likely to support such positive sentiment for long. Unless the recent medium-term conditions improve markedly, it's very challenging to accept these prices as being reasonable.
You need to take note of risks, for example - Aimflex Berhad has 3 warning signs (and 1 which is significant) we think you should know about.
If P/E ratios interest you, you may wish to see this free collection of other companies that have grown earnings strongly and trade on P/E's below 20x.
Have feedback on this article? Concerned about the content? Get in touch with us directly. Alternatively, email editorial-team (at) simplywallst.com.
This article by Simply Wall St is general in nature. We provide commentary based on historical data and analyst forecasts only using an unbiased methodology and our articles are not intended to be financial advice. It does not constitute a recommendation to buy or sell any stock, and does not take account of your objectives, or your financial situation. We aim to bring you long-term focused analysis driven by fundamental data. Note that our analysis may not factor in the latest price-sensitive company announcements or qualitative material. Simply Wall St has no position in any stocks mentioned.
Join A Paid User Research Session
You’ll receive a US$30 Amazon Gift card for 1 hour of your time while helping us build better investing tools for the individual investors like yourself. Sign up here
