
 Yahoo Finance
 Who Are EBOS Group Limited’s (NZSE:EBO) Major Shareholders?

Every investor in EBOS Group Limited (NZSE:EBO) should be aware of the most powerful shareholder groups. Large companies usually have institutions as shareholders, and we usually see insiders owning shares in smaller companies. Companies that used to be publicly owned tend to have lower insider ownership.
EBOS Group has a market capitalization of NZ$3.33b, so we would expect some institutional investors to have noticed the stock. Taking a look at the our data on the ownership groups (below), it’s seems that institutions own shares in the company. We can zoom in on the different ownership groups, to learn more about EBO.
See our latest analysis for EBOS Group
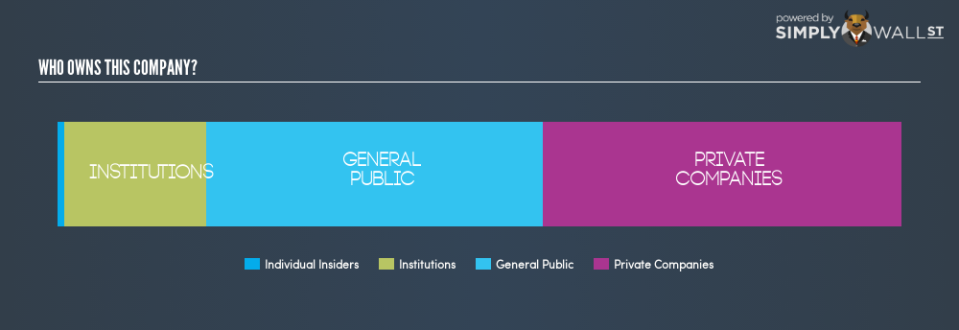
What Does The Institutional Ownership Tell Us About EBOS Group?
Many institutions measure their performance against an index that approximates the local market. So they usually pay more attention to companies that are included in major indices.
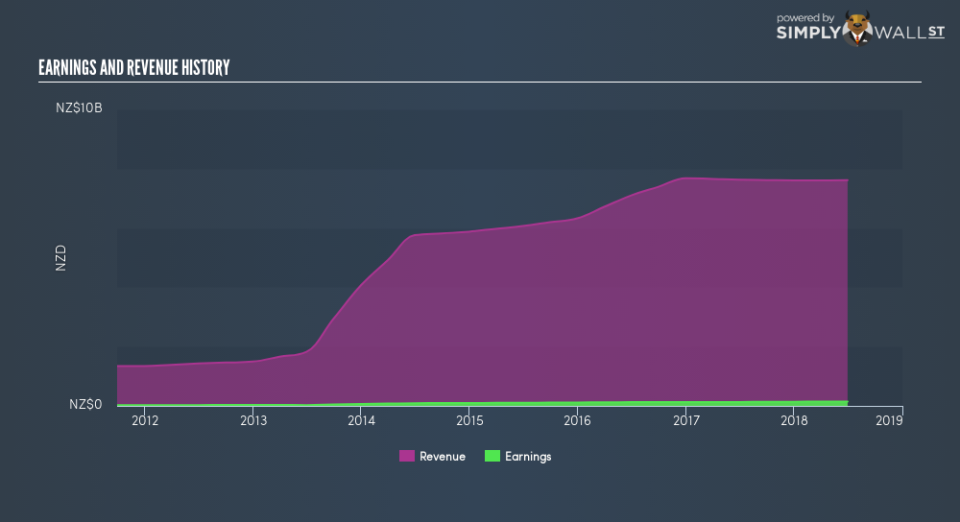
We can see that EBOS Group does have institutional investors; and they hold 16.8% of the stock. This implies the analysts working for those institutions have looked at the stock and they like it. But just like anyone else, they could be wrong. If multiple institutions change their view on a stock at the same time, you could see the share price drop fast. It’s therefore worth looking at EBOS Group’s earnings history, below. Of course, the future is what really matters.
We note that hedge funds don’t have a meaningful investment in EBOS Group. Quite a few analysts cover the stock, so you could look into forecast growth quite easily.
Insider Ownership Of EBOS Group
While the precise definition of an insider can be subjective, almost everyone considers board members to be insiders. The company management answer to the board; and the latter should represent the interests of shareholders. Notably, sometimes top-level managers are on the board, themselves.
Most consider insider ownership a positive because it can indicate the board is well aligned with other shareholders. However, on some occasions too much power is concentrated within this group.
Our most recent data indicates that insiders own less than 1% of EBOS Group Limited. However, it’s possible that insiders might have an indirect interest through a more complex structure. It’s a big company, so even a small proportional interest can create alignment between the board and shareholders. In this case insiders own NZ$32.0m worth of shares. It is good to see board members owning shares, but it might be worth checking if those insiders have been buying.
General Public Ownership
The general public holds a 39.9% stake in EBO. While this group can’t necessarily call the shots, it can certainly have a real influence on how the company is run.
Private Company Ownership
Our data indicates that Private Companies hold 42.4%, of the company’s shares. Private companies may be related parties. Sometimes insiders have an interest in a public company through a holding in a private company, rather than in their own capacity as an individual. While it’s hard to draw any broad stroke conclusions, it is worth noting as an area for further research.
Next Steps:
While it is well worth considering the different groups that own a company, there are other factors that are even more important.
Many find it useful to take an in depth look at how a company has performed in the past. You can access this detailed graph of past earnings, revenue and cash flow .
If you would prefer discover what analysts are predicting in terms of future growth, do not miss this free report on analyst forecasts.
NB: Figures in this article are calculated using data from the last twelve months, which refer to the 12-month period ending on the last date of the month the financial statement is dated. This may not be consistent with full year annual report figures.
To help readers see past the short term volatility of the financial market, we aim to bring you a long-term focused research analysis purely driven by fundamental data. Note that our analysis does not factor in the latest price-sensitive company announcements.
The author is an independent contributor and at the time of publication had no position in the stocks mentioned. For errors that warrant correction please contact the editor at editorial-team@simplywallst.com.
