
 Yahoo Finance
 Endeavour Group's (ASX:EDV) one-year earnings growth trails the 14% YoY shareholder returns
Passive investing in index funds can generate returns that roughly match the overall market. But one can do better than that by picking better than average stocks (as part of a diversified portfolio). To wit, the Endeavour Group Limited (ASX:EDV) share price is 10% higher than it was a year ago, much better than the market return of around 2.2% (not including dividends) in the same period. That's a solid performance by our standards! We'll need to follow Endeavour Group for a while to get a better sense of its share price trend, since it hasn't been listed for particularly long.
On the back of a solid 7-day performance, let's check what role the company's fundamentals have played in driving long term shareholder returns.
View our latest analysis for Endeavour Group
While the efficient markets hypothesis continues to be taught by some, it has been proven that markets are over-reactive dynamic systems, and investors are not always rational. One flawed but reasonable way to assess how sentiment around a company has changed is to compare the earnings per share (EPS) with the share price.
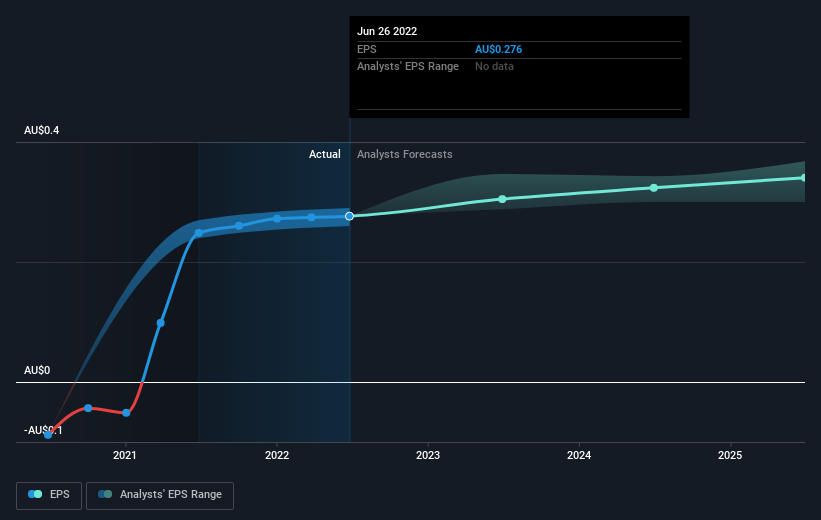
During the last year Endeavour Group grew its earnings per share (EPS) by 12%. This EPS growth is reasonably close to the 10% increase in the share price. This makes us think the market hasn't really changed its sentiment around the company, in the last year. We don't think its coincidental that the share price is growing at a similar rate to the earnings per share.
The image below shows how EPS has tracked over time (if you click on the image you can see greater detail).
We know that Endeavour Group has improved its bottom line lately, but is it going to grow revenue? You could check out this free report showing analyst revenue forecasts.
What About Dividends?
It is important to consider the total shareholder return, as well as the share price return, for any given stock. Whereas the share price return only reflects the change in the share price, the TSR includes the value of dividends (assuming they were reinvested) and the benefit of any discounted capital raising or spin-off. So for companies that pay a generous dividend, the TSR is often a lot higher than the share price return. In the case of Endeavour Group, it has a TSR of 14% for the last 1 year. That exceeds its share price return that we previously mentioned. This is largely a result of its dividend payments!
A Different Perspective
Endeavour Group boasts a total shareholder return of 14% for the last year (that includes the dividends) . Unfortunately the share price is down 2.7% over the last quarter. It may simply be that the share price got ahead of itself, although there may have been fundamental developments that are weighing on it. While it is well worth considering the different impacts that market conditions can have on the share price, there are other factors that are even more important. Take risks, for example - Endeavour Group has 1 warning sign we think you should be aware of.
Of course, you might find a fantastic investment by looking elsewhere. So take a peek at this free list of companies we expect will grow earnings.
Please note, the market returns quoted in this article reflect the market weighted average returns of stocks that currently trade on AU exchanges.
Have feedback on this article? Concerned about the content? Get in touch with us directly. Alternatively, email editorial-team (at) simplywallst.com.
This article by Simply Wall St is general in nature. We provide commentary based on historical data and analyst forecasts only using an unbiased methodology and our articles are not intended to be financial advice. It does not constitute a recommendation to buy or sell any stock, and does not take account of your objectives, or your financial situation. We aim to bring you long-term focused analysis driven by fundamental data. Note that our analysis may not factor in the latest price-sensitive company announcements or qualitative material. Simply Wall St has no position in any stocks mentioned.
Join A Paid User Research Session
You’ll receive a US$30 Amazon Gift card for 1 hour of your time while helping us build better investing tools for the individual investors like yourself. Sign up here
