
 Yahoo Finance
 EQB (TSE:EQB) Is Increasing Its Dividend To CA$0.33
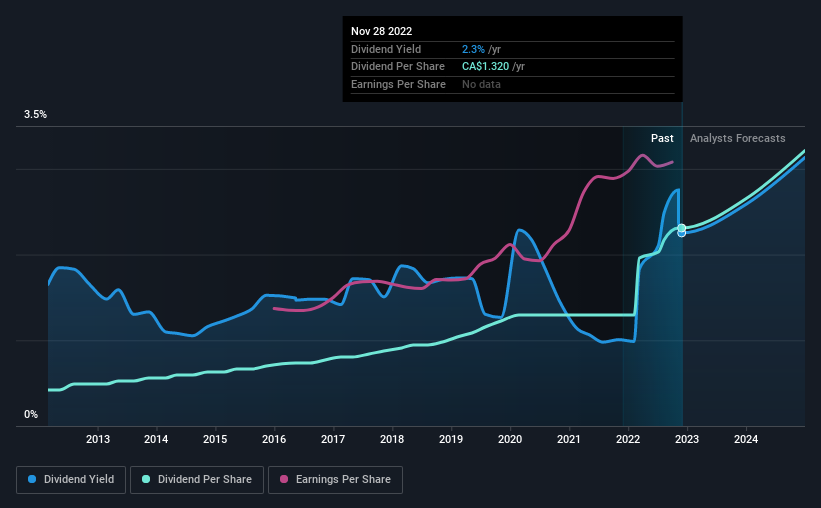
EQB Inc. (TSE:EQB) has announced that it will be increasing its dividend from last year's comparable payment on the 30th of December to CA$0.33. Even though the dividend went up, the yield is still quite low at only 2.3%.
Check out our latest analysis for EQB
EQB's Earnings Will Easily Cover The Distributions
It would be nice for the yield to be higher, but we should also check if higher levels of dividend payment would be sustainable.
Having distributed dividends for at least 10 years, EQB has a long history of paying out a part of its earnings to shareholders. Using data from its latest earnings report, EQB's payout ratio sits at 12%, an extremely comfortable number that shows that it can pay its dividend.
The next 3 years are set to see EPS grow by 42.3%. Analysts estimate the future payout ratio will be 16% over the same time period, which is in the range that makes us comfortable with the sustainability of the dividend.
EQB Has A Solid Track Record
Even over a long history of paying dividends, the company's distributions have been remarkably stable. The annual payment during the last 10 years was CA$0.24 in 2012, and the most recent fiscal year payment was CA$1.32. This means that it has been growing its distributions at 19% per annum over that time. We can see that payments have shown some very nice upward momentum without faltering, which provides some reassurance that future payments will also be reliable.
The Dividend Looks Likely To Grow
Some investors will be chomping at the bit to buy some of the company's stock based on its dividend history. EQB has seen EPS rising for the last five years, at 11% per annum. A low payout ratio and decent growth suggests that the company is reinvesting well, and it also has plenty of room to increase the dividend over time.
We should note that EQB has issued stock equal to 10% of shares outstanding. Regularly doing this can be detrimental - it's hard to grow dividends per share when new shares are regularly being created.
We Really Like EQB's Dividend
In summary, it is always positive to see the dividend being increased, and we are particularly pleased with its overall sustainability. Distributions are quite easily covered by earnings, which are also being converted to cash flows. All in all, this checks a lot of the boxes we look for when choosing an income stock.
Companies possessing a stable dividend policy will likely enjoy greater investor interest than those suffering from a more inconsistent approach. Still, investors need to consider a host of other factors, apart from dividend payments, when analysing a company. Case in point: We've spotted 2 warning signs for EQB (of which 1 doesn't sit too well with us!) you should know about. Is EQB not quite the opportunity you were looking for? Why not check out our selection of top dividend stocks.
Have feedback on this article? Concerned about the content? Get in touch with us directly. Alternatively, email editorial-team (at) simplywallst.com.
This article by Simply Wall St is general in nature. We provide commentary based on historical data and analyst forecasts only using an unbiased methodology and our articles are not intended to be financial advice. It does not constitute a recommendation to buy or sell any stock, and does not take account of your objectives, or your financial situation. We aim to bring you long-term focused analysis driven by fundamental data. Note that our analysis may not factor in the latest price-sensitive company announcements or qualitative material. Simply Wall St has no position in any stocks mentioned.
Join A Paid User Research Session
You’ll receive a US$30 Amazon Gift card for 1 hour of your time while helping us build better investing tools for the individual investors like yourself. Sign up here
