
 Yahoo Finance
 ETH/USD Price forecast for the week of January 22, 2018, Technical Analysis
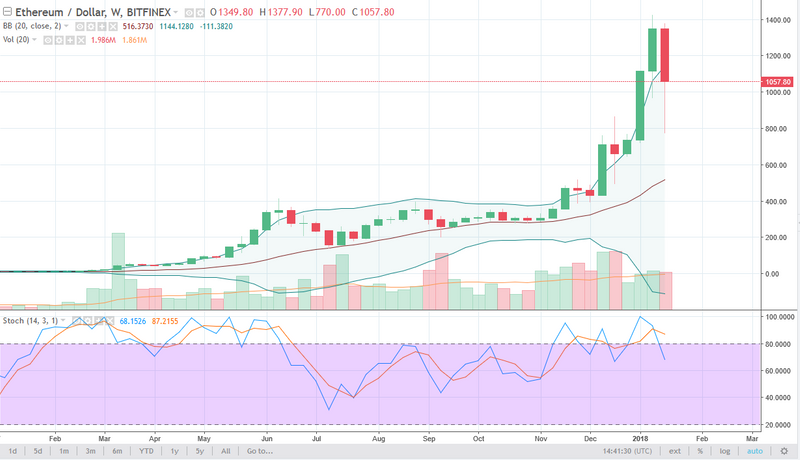
Ethereum markets fell rather significantly during the week, slicing below the $800 level at one point during the bloodbath. We have bounced rather significantly from there, and I would be the first to admit that the weekly chart looks very good when you look at it through the prism of a recovery. However, when you look at the shorter-term charts, there is a significant amount of concern with the rally. We are seeing less volume on the bounce, and that typically is not a good sign. I fully anticipate that this market is going to roll over again, perhaps testing the bottom of the candle. When you look at the weekly chart, we have gone parabolic, so this selloff was necessary. I think we are going to continue to see volume to the upside being thin, and that means it’s likely that the sellers will make their thoughts known again.
ETH/USD Video 22.01.18
Get Into Ethereum Trading Today
I believe that the markets are going to go looking towards the $1500 level, if the buyers have their way. However, I believe that another pullback is all but inevitable, so trading this market from the longer-term could be best described as one you should be waiting for value. You may have found it at $800, but I think we will see a return to that level, so if you missed out on an opportunity to pick it up at a lower level, you may get your opportunity within the next couple of weeks.
This article was originally posted on FX Empire
More From FXEMPIRE:
AUD/USD Price forecast for the week of January 22, 2018, Technical Analysis
BTC/USD Price forecast for the week of January 22, 2018, Technical Analysis
NZD/USD Price forecast for the week of January 22, 2018, Technical Analysis
USD/JPY Price forecast for the week of January 22, 2018, Technical Analysis
USD/CAD Price forecast for the week of January 22, 2018, Technical Analysis
GBP/USD Price forecast for the week of January 22, 2018, Technical Analysis
