
 Yahoo Finance
 Etherstack plc's (ASX:ESK) Fundamentals Look Pretty Strong: Could The Market Be Wrong About The Stock?
Etherstack (ASX:ESK) has had a rough three months with its share price down 18%. However, a closer look at its sound financials might cause you to think again. Given that fundamentals usually drive long-term market outcomes, the company is worth looking at. Particularly, we will be paying attention to Etherstack's ROE today.
Return on Equity or ROE is a test of how effectively a company is growing its value and managing investors’ money. In short, ROE shows the profit each dollar generates with respect to its shareholder investments.
View our latest analysis for Etherstack
How Do You Calculate Return On Equity?
ROE can be calculated by using the formula:
Return on Equity = Net Profit (from continuing operations) ÷ Shareholders' Equity
So, based on the above formula, the ROE for Etherstack is:
14% = US$783k ÷ US$5.5m (Based on the trailing twelve months to June 2021).
The 'return' is the income the business earned over the last year. That means that for every A$1 worth of shareholders' equity, the company generated A$0.14 in profit.
What Has ROE Got To Do With Earnings Growth?
Thus far, we have learned that ROE measures how efficiently a company is generating its profits. Depending on how much of these profits the company reinvests or "retains", and how effectively it does so, we are then able to assess a company’s earnings growth potential. Assuming everything else remains unchanged, the higher the ROE and profit retention, the higher the growth rate of a company compared to companies that don't necessarily bear these characteristics.
Etherstack's Earnings Growth And 14% ROE
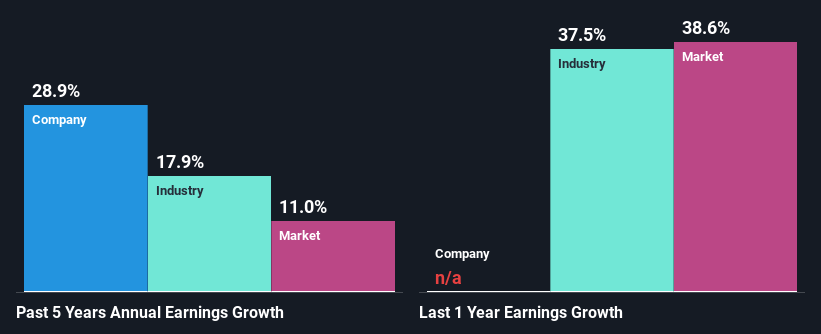
To begin with, Etherstack seems to have a respectable ROE. Further, the company's ROE compares quite favorably to the industry average of 10%. This probably laid the ground for Etherstack's significant 29% net income growth seen over the past five years. However, there could also be other causes behind this growth. For instance, the company has a low payout ratio or is being managed efficiently.
We then compared Etherstack's net income growth with the industry and we're pleased to see that the company's growth figure is higher when compared with the industry which has a growth rate of 18% in the same period.
Earnings growth is a huge factor in stock valuation. It’s important for an investor to know whether the market has priced in the company's expected earnings growth (or decline). Doing so will help them establish if the stock's future looks promising or ominous. One good indicator of expected earnings growth is the P/E ratio which determines the price the market is willing to pay for a stock based on its earnings prospects. So, you may want to check if Etherstack is trading on a high P/E or a low P/E, relative to its industry.
Is Etherstack Efficiently Re-investing Its Profits?
Summary
Overall, we are quite pleased with Etherstack's performance. Specifically, we like that the company is reinvesting a huge chunk of its profits at a high rate of return. This of course has caused the company to see substantial growth in its earnings. If the company continues to grow its earnings the way it has, that could have a positive impact on its share price given how earnings per share influence long-term share prices. Remember, the price of a stock is also dependent on the perceived risk. Therefore investors must keep themselves informed about the risks involved before investing in any company. To know the 4 risks we have identified for Etherstack visit our risks dashboard for free.
This article by Simply Wall St is general in nature. We provide commentary based on historical data and analyst forecasts only using an unbiased methodology and our articles are not intended to be financial advice. It does not constitute a recommendation to buy or sell any stock, and does not take account of your objectives, or your financial situation. We aim to bring you long-term focused analysis driven by fundamental data. Note that our analysis may not factor in the latest price-sensitive company announcements or qualitative material. Simply Wall St has no position in any stocks mentioned.
Have feedback on this article? Concerned about the content? Get in touch with us directly. Alternatively, email editorial-team (at) simplywallst.com.
