EUR/USD Mid-Session Technical Analysis for April 17, 2018
The Euro is trading lower against the U.S. Dollar shortly before the U.S. opening after giving back all of its earlier gains. Overall, the Forex pair remains rangebound as investors continue to address rising interest rates in the U.S. and the timing of a possible rate hike by the European Central Bank later this year or early next year. There doesn’t seem to be any urgency at this time to commit in a major way to either direction.
At 1018 GMT, the EUR/USD is trading 1.2368, down 0.0011 or -0.10%.

Daily Swing Chart Technical Analysis
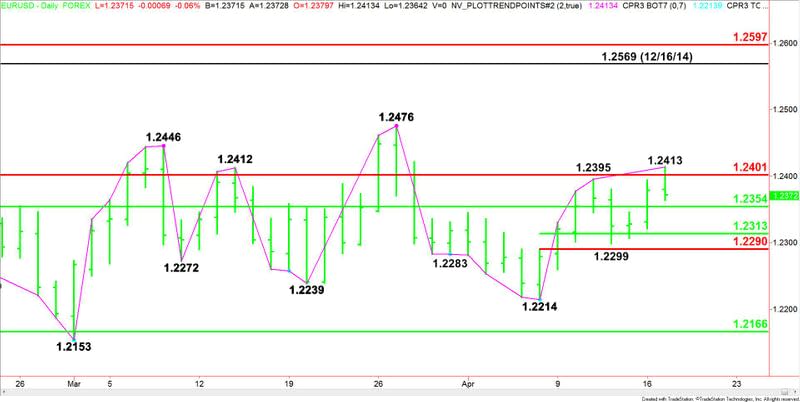
The main trend is up according to the daily swing chart. However, momentum has been trending higher since the formation of the closing price reversal bottom at 1.2214 on April 6. At the same time, the market is facing near-term resistance form the closing price reversal top formed at 1.2476 on March 27.
The main range is 1.2550 to 1.2153. Its retracement zone is 1.2354 to 1.2401. This zone is acting like a magnet, attracting both bullish and bearish traders. The EUR/USD is currently trading inside this zone after failing to sustain a rally over 1.2401 earlier in the session.
The new short-term range is 1.2214 to 1.2413. Its retracement zone at 1.2313 to 1.2290 is the primary downside target.
Daily Swing Chart Technical Forecast
Based on the early price action, the direction of the market today is likely to be determined by trader reaction to the Fibonacci level at 1.2401 and the 50% level at 1.2354.
A sustained move under 1.2401 will indicate the presence of sellers. However, the trigger point for an acceleration to the downside and an eventual move into 1.2313 to 1.2290 is the 50% level at 1.2354.
Holding 1.2354 will indicate the presence of buyers, however, its potential trigger point for an acceleration to the upside is 1.2401.
If volume slows throughout the session then look for the EUR/USD to drift sideways inside 1.2401 to 1.2354.
This article was originally posted on FX Empire

 Yahoo Finance