
 Yahoo Finance
 Even though Asana (NYSE:ASAN) has lost US$7.2b market cap in last 7 days, shareholders are still up 153% over 1 year
Asana, Inc. (NYSE:ASAN) shareholders might be rather concerned because the share price has dropped 49% in the last month. But that doesn't detract from the splendid returns of the last year. We're very pleased to report the share price shot up 153% in that time. So it may be that the share price is simply cooling off after a strong rise. The real question is whether the business is trending in the right direction.
In light of the stock dropping 37% in the past week, we want to investigate the longer term story, and see if fundamentals have been the driver of the company's positive one-year return.
View our latest analysis for Asana
Asana wasn't profitable in the last twelve months, it is unlikely we'll see a strong correlation between its share price and its earnings per share (EPS). Arguably revenue is our next best option. Shareholders of unprofitable companies usually expect strong revenue growth. That's because it's hard to be confident a company will be sustainable if revenue growth is negligible, and it never makes a profit.
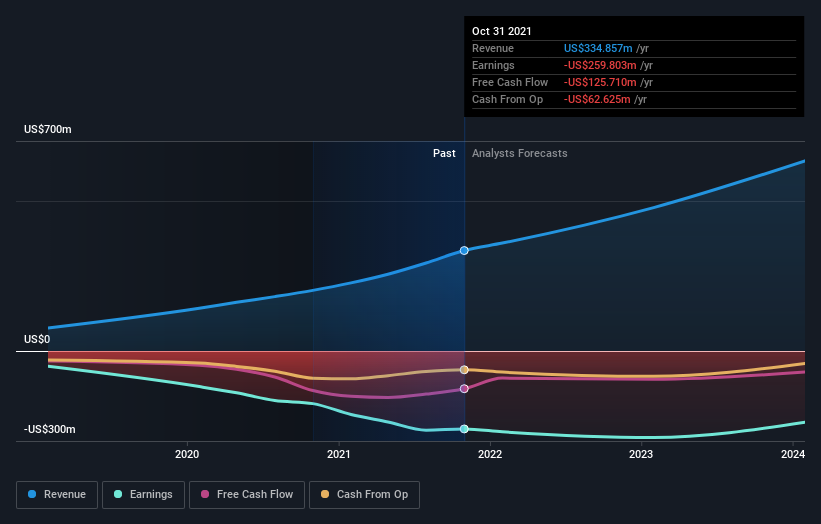
Over the last twelve months, Asana's revenue grew by 66%. That's stonking growth even when compared to other loss-making stocks. And the share price has responded, gaining 153% as we previously mentioned. It's great to see strong revenue growth, but the question is whether it can be sustained. Given the positive sentiment around the stock we're cautious, but there's no doubt its worth watching.
The image below shows how earnings and revenue have tracked over time (if you click on the image you can see greater detail).
We consider it positive that insiders have made significant purchases in the last year. Having said that, most people consider earnings and revenue growth trends to be a more meaningful guide to the business. If you are thinking of buying or selling Asana stock, you should check out this free report showing analyst profit forecasts.
A Different Perspective
Asana boasts a total shareholder return of 153% for the last year. We regret to report that the share price is down 29% over ninety days. Shorter term share price moves often don't signify much about the business itself. While it is well worth considering the different impacts that market conditions can have on the share price, there are other factors that are even more important. Take risks, for example - Asana has 3 warning signs we think you should be aware of.
If you like to buy stocks alongside management, then you might just love this free list of companies. (Hint: insiders have been buying them).
Please note, the market returns quoted in this article reflect the market weighted average returns of stocks that currently trade on US exchanges.
Have feedback on this article? Concerned about the content? Get in touch with us directly. Alternatively, email editorial-team (at) simplywallst.com.
This article by Simply Wall St is general in nature. We provide commentary based on historical data and analyst forecasts only using an unbiased methodology and our articles are not intended to be financial advice. It does not constitute a recommendation to buy or sell any stock, and does not take account of your objectives, or your financial situation. We aim to bring you long-term focused analysis driven by fundamental data. Note that our analysis may not factor in the latest price-sensitive company announcements or qualitative material. Simply Wall St has no position in any stocks mentioned.
