
 Yahoo Finance
 Expedia (EXPE) Beats Q2 Earnings Estimates, Revenues Up Y/Y


Expedia Group, Inc. EXPE delivered robust second-quarter 2018 adjusted earnings of $1.38 per share, surpassing the Zacks Consensus Estimate of 91 cents. The figure also compared favorably with the loss of 46 cents incurred in the previous quarter and increased a whopping 55.1% on a year-over-year basis.
Revenues increased 14.7% sequentially and 11.2% on a year-over-year basis to $2.88 billion. Top-line growth was driven by robust performance of HomeAway, Core OTA, Brand Expedia, Hotels.com and Expedia Partner Solutions which accelerated the company’s gross bookings and stayed lodging room nights numbers.
The figure came slightly below the Zacks Consensus Estimate of $2.89 billion.
Expedia recorded gross bookings of $25.9 billion in the second quarter, improving 13.6% year over year but declined 4.8% sequentially. Further, the figure came in line with the Zacks Consensus Estimate.
Nevertheless, shares of Expedia have returned 5.1% on a year-to-date basis, underperforming the industry’s rally of 31.5%.
However, we note that shares of Expedia rose by 9.14% in the after-hours trading on Thursday. This can be primarily attributed to impressive growth in bottom-line and gross bookings.
Revenues by Segment
Core OTA segment revenues (78.2% of total revenues) increased 12.1% year over year and 17.2% on a sequential basis to $2.25 billion. The segment witnessed 11.1% year over year growth in its gross bookings which came to $21 billion.
Egencia revenues (5.4% of revenues) increased 15.6% on year-over-year basis and 3.3% sequentially to $156 million. This can be attributed to strong performance in quarterly bookings which came in $2.1 billion. Additionally, the segment witnessed growth of 21% in the stayed room nights for the first time over the past two years.
HomeAway (10.3% of revenues) generated $297 million in the quarter, surging 32.6% from the year-ago quarter and 26.9% sequentially. HomeAway witnessed year-over-year growth of 33.3% in its gross bookings, which were pegged at $2.8 billion in the quarter. Further, the segment experienced growth of 33% in the stayed property nights on a year-over-year basis. Further, HomeAway’s online bookable listings crossed 1.7 million which exhibited growth of 20% from the year-ago quarter.
Moreover, trivago revenues (9.7% of revenues) declined 14.6% year over year and 12.2% sequentially to $280 million. The fall was owing to unfavorable changes in its marketplace.
Revenues by Business Model
Merchant model generated revenues of $1.53 billion (53.2% of revenues), up 10.9% year over year and 15% sequentially.
Agency division generated revenues of $777 million (27% of revenues), surging 13.6% from the prior-year quarter and 18.1% sequentially.
Advertising & Media yielded $274 million of revenues (9.5% of revenues), declining 9.2% from the year-ago quarter and 2.8% sequentially. Although, the Media Solutions business exhibited strong growth during the quarter, offset by decline in Trivago revenues.
Moreover, HomeAway (10.3% of revenues) generated $297 million in the quarter, advancing 32.6% from the year-ago quarter and 26.9% sequentially.
Revenues by Geography
Expedia generated $1.63 billion revenues (56.6% of total revenues) from domestic regions, up 11.6% from the prior-year quarter and 20.7% sequentially. This was primarily driven by the company’s strong initiatives toward expansion of its presence in the domestic regions and improving domestic room nights.
Further, revenues generated by international regions were $1.25 billion (43.4% of revenues), up 10.6% on a year-over-year basis and 8.7% from the previous quarter.
Revenues by Product Line
Lodging revenues (69.2% of total revenues) came in $1.99 billion, surged 14.4% from the prior-year quarter and 23.6% sequentially. This can be attributed to 12% year-over-year growth in stayed lodging and 2% improvement in revenue per room night. Further, strong momentum in HomeAway, Hotels.com, Expedia Partner Solutions and Brand Expedia drove the lodging revenues.
Further, Expedia’s global lodging portfolio went beyond 750K properties by acquiring more than 60K properties wherein HomeAway alone acquired 20K properties during the second quarter.
Air revenues were $223 million (7.7% of reveneus), which were up 10.4% year over year but declined 7.8% on a sequential basis. Year-over-year growth was driven by 6% increase in air tickets sold and 4% increase in revenues per ticket faring better than the airfare growth of 1%.
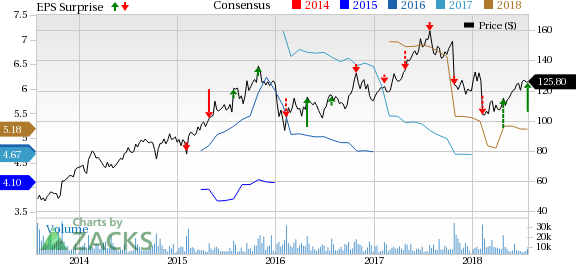
Expedia, Inc. Price, Consensus and EPS Surprise
Expedia, Inc. Price, Consensus and EPS Surprise | Expedia, Inc. Quote
Operating Details
Adjusted EBITDA improved massively 18% year over year and 273.4% on a sequential basis to $463 million. This can be attributed to rise in segmental EBITDA. Notably, Home Away EBITDA rose significantly 98% year over year. Further, Core OTA and Egencia EBITDA grew 16% and 8%, respectively.
Per the company, operating margin came in 3.8%, which contracted 10 basis points (bps) from the year-ago quarter. This can be attributed to operating loss incurred by Trivago during the second quarter. Excluding Trivago, the company’s operating margin would have expanded 100 bps.
Moreover, adjusted selling and marketing expenses grew 7% year over year, primarily due to increased online and offline marketing expenditure.
Balance Sheet & Cash Flow
As of Jun 30, 2018, cash and cash equivalents were $3.07 billion compared with $3.42 billion as of Mar 31, 2017. Short-term investments totaled $1.49 billion, which increased from $1.03 million in the last quarter.
Further, Expedia generated nearly $596 million of free cash flow in the second quarter. The company paid quarterly dividend worth $46 million (30 cents per share) at the end of the quarter.
Moreover, Expedia repurchased nearly 4 million shares for a total of $451 million on a year-to-date basis.
Guidance For 2018
Expedia raised guidance for adjusted EBITDA growth, which is currently expected to in the range of 7-12%, up from the previous guidance of 6-11%.
Zacks Rank & Stocks to Consider
Expedia carries a Zacks Rank #3 (Hold).
Some better-ranked stocks in the broader technology sector are Micron Technology MU, Analog Devices ADI and Stoneridge SRI. While Micron Technology sports a Zacks Rank #1 (Strong Buy), Analog Devices and Stoneridge carry a Zacks Rank #2 (Buy). You can see the complete list of today’s Zacks #1 Rank stocks here.
Long-term earnings growth rate for Micron Technology, Analog Devices and Stoneridge is pegged at 8.18%, 12.4% and 8.5%, respectively.
5 Medical Stocks to Buy Now
Zacks names 5 companies poised to ride a medical breakthrough that is targeting cures for leukemia, AIDS, muscular dystrophy, hemophilia, and other conditions.
New products in this field are already generating substantial revenue and even more wondrous treatments are in the pipeline. Early investors could realize exceptional profits.
Click here to see the 5 stocks >>
Want the latest recommendations from Zacks Investment Research? Today, you can download 7 Best Stocks for the Next 30 Days. Click to get this free report
Expedia, Inc. (EXPE) : Free Stock Analysis Report
Stoneridge, Inc. (SRI) : Free Stock Analysis Report
Analog Devices, Inc. (ADI) : Free Stock Analysis Report
Micron Technology, Inc. (MU) : Free Stock Analysis Report
To read this article on Zacks.com click here.
