
 Yahoo Finance
 Exxon Mobil Corporation’s (NYSE:XOM) Investment Returns Are Lagging Its Industry

Today we are going to look at Exxon Mobil Corporation (NYSE:XOM) to see whether it might be an attractive investment prospect. Specifically, we're going to calculate its Return On Capital Employed (ROCE), in the hopes of getting some insight into the business.
First, we'll go over how we calculate ROCE. Next, we'll compare it to others in its industry. Finally, we'll look at how its current liabilities affect its ROCE.
Understanding Return On Capital Employed (ROCE)
ROCE measures the 'return' (pre-tax profit) a company generates from capital employed in its business. In general, businesses with a higher ROCE are usually better quality. In brief, it is a useful tool, but it is not without drawbacks. Renowned investment researcher Michael Mauboussin has suggested that a high ROCE can indicate that 'one dollar invested in the company generates value of more than one dollar'.
How Do You Calculate Return On Capital Employed?
The formula for calculating the return on capital employed is:
Return on Capital Employed = Earnings Before Interest and Tax (EBIT) ÷ (Total Assets - Current Liabilities)
Or for Exxon Mobil:
0.049 = US$14b ÷ (US$359b - US$64b) (Based on the trailing twelve months to September 2019.)
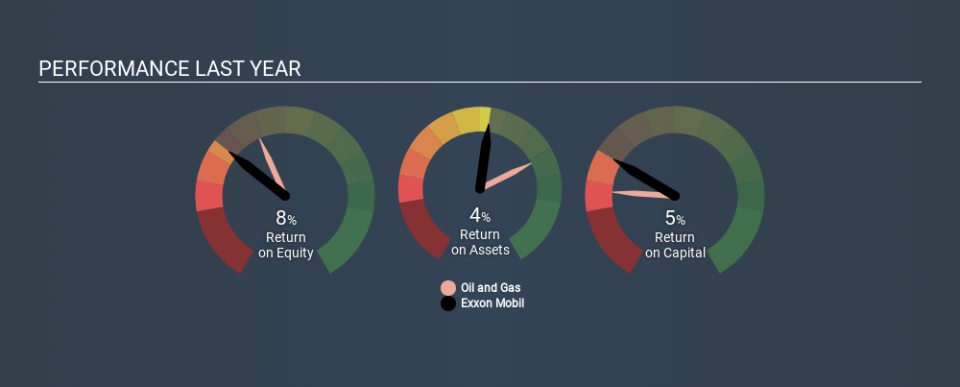
So, Exxon Mobil has an ROCE of 4.9%.
See our latest analysis for Exxon Mobil
Does Exxon Mobil Have A Good ROCE?
ROCE is commonly used for comparing the performance of similar businesses. We can see Exxon Mobil's ROCE is meaningfully below the Oil and Gas industry average of 9.0%. This performance could be negative if sustained, as it suggests the business may underperform its industry. Separate from how Exxon Mobil stacks up against its industry, its ROCE in absolute terms is mediocre; relative to the returns on government bonds. Investors may wish to consider higher-performing investments.
Our data shows that Exxon Mobil currently has an ROCE of 4.9%, compared to its ROCE of 1.6% 3 years ago. This makes us think the business might be improving. You can see in the image below how Exxon Mobil's ROCE compares to its industry. Click to see more on past growth.
Remember that this metric is backwards looking - it shows what has happened in the past, and does not accurately predict the future. Companies in cyclical industries can be difficult to understand using ROCE, as returns typically look high during boom times, and low during busts. This is because ROCE only looks at one year, instead of considering returns across a whole cycle. Given the industry it operates in, Exxon Mobil could be considered cyclical. Since the future is so important for investors, you should check out our free report on analyst forecasts for Exxon Mobil.
How Exxon Mobil's Current Liabilities Impact Its ROCE
Current liabilities are short term bills and invoices that need to be paid in 12 months or less. Due to the way the ROCE equation works, having large bills due in the near term can make it look as though a company has less capital employed, and thus a higher ROCE than usual. To counter this, investors can check if a company has high current liabilities relative to total assets.
Exxon Mobil has total liabilities of US$64b and total assets of US$359b. As a result, its current liabilities are equal to approximately 18% of its total assets. This is a modest level of current liabilities, which would only have a small effect on ROCE.
The Bottom Line On Exxon Mobil's ROCE
If Exxon Mobil continues to earn an uninspiring ROCE, there may be better places to invest. But note: make sure you look for a great company, not just the first idea you come across. So take a peek at this free list of interesting companies with strong recent earnings growth (and a P/E ratio below 20).
I will like Exxon Mobil better if I see some big insider buys. While we wait, check out this free list of growing companies with considerable, recent, insider buying.
If you spot an error that warrants correction, please contact the editor at editorial-team@simplywallst.com. This article by Simply Wall St is general in nature. It does not constitute a recommendation to buy or sell any stock, and does not take account of your objectives, or your financial situation. Simply Wall St has no position in the stocks mentioned.
We aim to bring you long-term focused research analysis driven by fundamental data. Note that our analysis may not factor in the latest price-sensitive company announcements or qualitative material. Thank you for reading.
