
 Yahoo Finance
 Fentura Financial, Inc. Announces Fourth Quarter 2022 Earnings (unaudited)

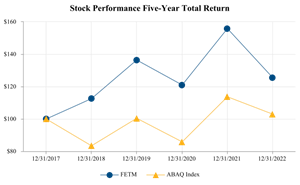
Stock Performance Five-Year Total Return
Dollars in thousands except per share amounts. Certain items in the prior period financial statements have been reclassified to conform with the December 31, 2022 presentation.
FENTON, Mich., Jan. 31, 2023 (GLOBE NEWSWIRE) -- Fentura Financial, Inc. (OTCQX: FETM) announces quarterly and year to date results of net income of $4,364 and $14,933 in 2022.
Ronald L. Justice, President and CEO, stated, "Our 2022 performance reflects another year of strong profitability, record loan growth, and robust asset quality. Net interest income increased 18.7% to an annual record of $52.5 million as a result of a 30.5% increase in gross loans, and a nine basis point expansion in our net interest margin. This growth helped partially offset a higher provision for loan losses associated with the significant growth we experienced in our loan portfolio, reduced noninterest income due to a meaningful reduction in the sale of residential mortgages, and higher noninterest expense. In addition, the growth we experienced in gross loans during 2022 contributed to a 19.6% year-over-year increase in total assets, which ended the year at a record of $1.69 billion.”
Mr. Justice continued, “As we look to 2023, we plan to focus on expanding net interest income by capitalizing on the growth we have produced over the past several years. In fact, since 2018, we have nearly doubled our loan portfolio, while we have preserved asset quality and maintained a stable net interest margin. Additionally, we believe we are well positioned to navigate a more uncertain economic period as we focus on sustaining excellent asset quality, controlling operating expenses, and providing superior financial services to our customers and communities. As a result, we believe 2023 will be another good year for Fentura Financial."
Following is a discussion of our financial performance as of, and for the year ended December 31, 2022. At the end of this document is a list of abbreviations and acronyms.
Results of Operations (unaudited)
The following table outlines our QTD results of operations and provides certain performance measures as of, and for the three months ended:
|
| 12/31/2022 |
| 9/30/2022 |
| 6/30/2022 |
| 3/31/2022 |
| 12/31/2021 | ||||||||||
INCOME STATEMENT DATA |
|
|
|
|
|
|
|
|
|
| ||||||||||
Interest income |
| $ | 17,782 |
|
| $ | 15,726 |
|
| $ | 13,411 |
|
| $ | 12,301 |
|
| $ | 11,749 |
|
Interest expense |
|
| 3,645 |
|
|
| 1,738 |
|
|
| 785 |
|
|
| 599 |
|
|
| 645 |
|
Net interest income |
|
| 14,137 |
|
|
| 13,988 |
|
|
| 12,626 |
|
|
| 11,702 |
|
|
| 11,104 |
|
Provision for loan losses |
|
| 847 |
|
|
| 1,231 |
|
|
| 525 |
|
|
| 502 |
|
|
| 38 |
|
Noninterest income |
|
| 1,933 |
|
|
| 2,377 |
|
|
| 2,778 |
|
|
| 2,792 |
|
|
| 3,097 |
|
Noninterest expenses |
|
| 9,765 |
|
|
| 10,125 |
|
|
| 10,544 |
|
|
| 10,151 |
|
|
| 9,957 |
|
Federal income tax expense |
|
| 1,094 |
|
|
| 1,000 |
|
|
| 859 |
|
|
| 757 |
|
|
| 864 |
|
Net income |
| $ | 4,364 |
|
| $ | 4,009 |
|
| $ | 3,476 |
|
| $ | 3,084 |
|
| $ | 3,342 |
|
PER SHARE |
|
|
|
|
|
|
|
|
|
| ||||||||||
Earnings |
| $ | 0.99 |
|
| $ | 0.91 |
|
| $ | 0.79 |
|
| $ | 0.69 |
|
| $ | 0.74 |
|
Dividends |
| $ | 0.09 |
|
| $ | 0.09 |
|
| $ | 0.09 |
|
| $ | 0.09 |
|
| $ | 0.08 |
|
Tangible book value(1) |
| $ | 26.22 |
|
| $ | 25.22 |
|
| $ | 24.53 |
|
| $ | 24.97 |
|
| $ | 25.43 |
|
Quoted market value |
|
|
|
|
|
|
|
|
|
| ||||||||||
High |
| $ | 23.40 |
|
| $ | 25.20 |
|
| $ | 27.85 |
|
| $ | 29.25 |
|
| $ | 28.28 |
|
Low |
| $ | 21.60 |
|
| $ | 23.00 |
|
| $ | 24.40 |
|
| $ | 27.10 |
|
| $ | 25.75 |
|
Close(1) |
| $ | 22.20 |
|
| $ | 23.00 |
|
| $ | 25.00 |
|
| $ | 27.90 |
|
| $ | 28.28 |
|
PERFORMANCE RATIOS |
|
|
|
|
|
|
|
|
|
| ||||||||||
Return on average assets |
|
| 1.06 | % |
|
| 1.02 | % |
|
| 0.96 | % |
|
| 0.86 | % |
|
| 0.98 | % |
Return on average shareholders' equity |
|
| 14.01 | % |
|
| 12.96 | % |
|
| 11.55 | % |
|
| 10.53 | % |
|
| 10.56 | % |
Return on average tangible shareholders' equity |
|
| 15.21 | % |
|
| 14.10 | % |
|
| 12.60 | % |
|
| 11.49 | % |
|
| 10.87 | % |
Efficiency ratio |
|
| 60.77 | % |
|
| 61.87 | % |
|
| 68.45 | % |
|
| 70.04 | % |
|
| 70.11 | % |
Yield on earning assets (FTE) |
|
| 4.57 | % |
|
| 4.27 | % |
|
| 3.96 | % |
|
| 3.70 | % |
|
| 3.67 | % |
Rate on interest bearing liabilities |
|
| 1.42 | % |
|
| 0.75 | % |
|
| 0.38 | % |
|
| 0.29 | % |
|
| 0.33 | % |
Net interest margin to earning assets (FTE) |
|
| 3.63 | % |
|
| 3.79 | % |
|
| 3.73 | % |
|
| 3.52 | % |
|
| 3.47 | % |
BALANCE SHEET DATA(1) |
|
|
|
|
|
|
|
|
|
| ||||||||||
Total investment securities |
| $ | 125,049 |
|
| $ | 129,886 |
|
| $ | 136,725 |
|
| $ | 151,579 |
|
| $ | 164,942 |
|
Gross loans |
| $ | 1,436,166 |
|
| $ | 1,350,851 |
|
| $ | 1,232,892 |
|
| $ | 1,139,351 |
|
| $ | 1,100,092 |
|
Allowance for loan losses |
| $ | 13,000 |
|
| $ | 12,200 |
|
| $ | 11,000 |
|
| $ | 11,000 |
|
| $ | 10,500 |
|
Total assets |
| $ | 1,694,999 |
|
| $ | 1,595,126 |
|
| $ | 1,474,307 |
|
| $ | 1,435,501 |
|
| $ | 1,417,801 |
|
Total deposits |
| $ | 1,332,883 |
|
| $ | 1,345,209 |
|
| $ | 1,231,543 |
|
| $ | 1,252,892 |
|
| $ | 1,228,298 |
|
Borrowed funds |
| $ | 222,350 |
|
| $ | 116,600 |
|
| $ | 111,000 |
|
| $ | 52,000 |
|
| $ | 50,000 |
|
Total shareholders' equity |
| $ | 126,087 |
|
| $ | 121,630 |
|
| $ | 118,566 |
|
| $ | 121,346 |
|
| $ | 124,455 |
|
Net loans to total deposits |
|
| 106.77 | % |
|
| 99.51 | % |
|
| 99.22 | % |
|
| 90.06 | % |
|
| 88.71 | % |
Common shares outstanding |
|
| 4,439,725 |
|
|
| 4,434,937 |
|
|
| 4,429,357 |
|
|
| 4,459,544 |
|
|
| 4,496,701 |
|
QTD BALANCE SHEET AVERAGES |
|
|
|
|
|
|
|
|
|
| ||||||||||
Total assets |
| $ | 1,637,191 |
|
| $ | 1,558,040 |
|
| $ | 1,449,874 |
|
| $ | 1,448,545 |
|
| $ | 1,353,694 |
|
Earning assets |
| $ | 1,544,880 |
|
| $ | 1,464,233 |
|
| $ | 1,360,658 |
|
| $ | 1,348,647 |
|
| $ | 1,273,650 |
|
Interest bearing liabilities |
| $ | 1,016,876 |
|
| $ | 917,888 |
|
| $ | 826,708 |
|
| $ | 831,200 |
|
| $ | 773,082 |
|
Total shareholders' equity |
| $ | 123,567 |
|
| $ | 122,695 |
|
| $ | 120,659 |
|
| $ | 118,759 |
|
| $ | 125,500 |
|
Total tangible shareholders' equity |
| $ | 113,810 |
|
| $ | 112,829 |
|
| $ | 110,686 |
|
| $ | 108,862 |
|
| $ | 121,933 |
|
Earned common shares outstanding |
|
| 4,413,710 |
|
|
| 4,408,399 |
|
|
| 4,417,447 |
|
|
| 4,451,607 |
|
|
| 4,520,962 |
|
Unvested stock grants |
|
| 24,460 |
|
|
| 24,460 |
|
|
| 24,460 |
|
|
| 27,466 |
|
|
| 20,671 |
|
Total common shares outstanding |
|
| 4,438,170 |
|
|
| 4,432,859 |
|
|
| 4,441,907 |
|
|
| 4,479,073 |
|
|
| 4,541,633 |
|
ASSET QUALITY |
|
|
|
|
|
|
|
|
|
| ||||||||||
Nonperforming loans to gross loans (1) |
|
| 0.16 | % |
|
| 0.12 | % |
|
| 0.16 | % |
|
| 0.20 | % |
|
| 0.18 | % |
Nonperforming assets to total assets (1) |
|
| 0.15 | % |
|
| 0.12 | % |
|
| 0.16 | % |
|
| 0.19 | % |
|
| 0.17 | % |
Allowance for loan losses to gross loans (1) |
|
| 0.91 | % |
|
| 0.90 | % |
|
| 0.89 | % |
|
| 0.97 | % |
|
| 0.95 | % |
Allowance for loan losses to gross loans, net of PPP loans (1) |
|
| 0.91 | % |
|
| 0.90 | % |
|
| 0.89 | % |
|
| 0.97 | % |
|
| 0.96 | % |
Net charge-offs (recoveries) to QTD average gross loans |
|
| — | % |
|
| — | % |
|
| 0.04 | % |
|
| — | % |
|
| — | % |
Provision for loan losses to QTD average gross loans |
|
| 0.06 | % |
|
| 0.10 | % |
|
| 0.04 | % |
|
| 0.05 | % |
|
| — | % |
CAPITAL RATIOS(1) |
|
|
|
|
|
|
|
|
|
| ||||||||||
Total capital to risk weighted assets |
|
| 10.84 | % |
|
| 10.96 | % |
|
| 11.36 | % |
|
| 12.07 | % |
|
| 12.22 | % |
Tier 1 capital to risk weighted assets |
|
| 9.93 | % |
|
| 10.07 | % |
|
| 10.50 | % |
|
| 11.13 | % |
|
| 11.30 | % |
CET1 capital to risk weighted assets |
|
| 8.94 | % |
|
| 9.04 | % |
|
| 9.39 | % |
|
| 9.94 | % |
|
| 10.07 | % |
Tier 1 leverage ratio |
|
| 8.75 | % |
|
| 8.91 | % |
|
| 9.30 | % |
|
| 9.07 | % |
|
| 9.13 | % |
|
|
|
|
|
|
|
|
|
|
| ||||||||||
(1)At end of period |
|
|
|
|
|
|
|
|
|
| ||||||||||
The following table outlines our YTD results of operations and provides certain performance measures as of, and for the twelve months ended:
|
| (unaudited) |
|
|
|
|
|
|
|
| ||||||||||
|
| 12/31/2022 |
| 12/31/2021 |
| 12/31/2020 |
| 12/31/2019 |
| 12/31/2018 | ||||||||||
INCOME STATEMENT DATA |
|
|
|
|
|
|
|
|
|
| ||||||||||
Interest income |
| $ | 59,220 |
|
| $ | 46,910 |
|
| $ | 45,979 |
|
| $ | 43,541 |
|
| $ | 36,350 |
|
Interest expense |
|
| 6,767 |
|
|
| 2,736 |
|
|
| 5,924 |
|
|
| 8,627 |
|
|
| 5,827 |
|
Net interest income |
|
| 52,453 |
|
|
| 44,174 |
|
|
| 40,055 |
|
|
| 34,914 |
|
|
| 30,523 |
|
Provision for loan losses |
|
| 3,105 |
|
|
| (180 | ) |
|
| 5,634 |
|
|
| 1,335 |
|
|
| 1,057 |
|
Noninterest income |
|
| 9,880 |
|
|
| 14,080 |
|
|
| 19,640 |
|
|
| 8,163 |
|
|
| 8,277 |
|
Noninterest expenses |
|
| 40,585 |
|
|
| 37,663 |
|
|
| 34,684 |
|
|
| 27,223 |
|
|
| 25,310 |
|
Federal income tax expense |
|
| 3,710 |
|
|
| 4,192 |
|
|
| 3,913 |
|
|
| 2,941 |
|
|
| 2,319 |
|
Net income |
| $ | 14,933 |
|
| $ | 16,579 |
|
| $ | 15,464 |
|
| $ | 11,578 |
|
| $ | 10,114 |
|
PER SHARE |
|
|
|
|
|
|
|
|
|
| ||||||||||
Earnings |
| $ | 3.38 |
|
| $ | 3.60 |
|
| $ | 3.31 |
|
| $ | 2.49 |
|
| $ | 2.65 |
|
Dividends |
| $ | 0.36 |
|
| $ | 0.32 |
|
| $ | 0.30 |
|
| $ | 0.28 |
|
| $ | 0.24 |
|
Tangible book value(1) |
| $ | 26.22 |
|
| $ | 25.43 |
|
| $ | 23.88 |
|
| $ | 20.87 |
|
| $ | 18.32 |
|
Quoted market value |
|
|
|
|
|
|
|
|
|
| ||||||||||
High |
| $ | 29.25 |
|
| $ | 28.28 |
|
| $ | 26.00 |
|
| $ | 25.50 |
|
| $ | 23.00 |
|
Low |
| $ | 21.60 |
|
| $ | 21.90 |
|
| $ | 12.55 |
|
| $ | 20.05 |
|
| $ | 18.88 |
|
Close(1) |
| $ | 22.20 |
|
| $ | 28.28 |
|
| $ | 22.00 |
|
| $ | 25.23 |
|
| $ | 21.00 |
|
PERFORMANCE RATIOS |
|
|
|
|
|
|
|
|
|
| ||||||||||
Return on average assets |
|
| 0.98 | % |
|
| 1.26 | % |
|
| 1.29 | % |
|
| 1.20 | % |
|
| 1.20 | % |
Return on average shareholders' equity |
|
| 12.30 | % |
|
| 13.52 | % |
|
| 14.05 | % |
|
| 12.02 | % |
|
| 15.05 | % |
Return on average tangible shareholders' equity |
|
| 13.39 | % |
|
| 13.93 | % |
|
| 14.57 | % |
|
| 12.59 | % |
|
| 16.23 | % |
Efficiency ratio |
|
| 65.11 | % |
|
| 64.65 | % |
|
| 58.10 | % |
|
| 63.20 | % |
|
| 65.23 | % |
Yield on earning assets (FTE) |
|
| 4.15 | % |
|
| 3.80 | % |
|
| 4.01 | % |
|
| 4.77 | % |
|
| 4.57 | % |
Rate on interest bearing liabilities |
|
| 0.75 | % |
|
| 0.36 | % |
|
| 0.82 | % |
|
| 1.41 | % |
|
| 1.07 | % |
Net interest margin to earning assets (FTE) |
|
| 3.67 | % |
|
| 3.58 | % |
|
| 3.50 | % |
|
| 3.83 | % |
|
| 3.84 | % |
BALANCE SHEET DATA(1) |
|
|
|
|
|
|
|
|
|
| ||||||||||
Total investment securities |
| $ | 125,049 |
|
| $ | 164,942 |
|
| $ | 76,111 |
|
| $ | 61,621 |
|
| $ | 94,721 |
|
Gross loans |
| $ | 1,436,166 |
|
| $ | 1,100,092 |
|
| $ | 1,066,562 |
|
| $ | 870,555 |
|
| $ | 772,227 |
|
Allowance for loan losses |
| $ | 13,000 |
|
| $ | 10,500 |
|
| $ | 10,900 |
|
| $ | 5,813 |
|
| $ | 4,488 |
|
Total assets |
| $ | 1,694,999 |
|
| $ | 1,417,801 |
|
| $ | 1,251,446 |
|
| $ | 1,034,759 |
|
| $ | 926,450 |
|
Total deposits |
| $ | 1,332,883 |
|
| $ | 1,228,298 |
|
| $ | 1,071,976 |
|
| $ | 863,102 |
|
| $ | 763,124 |
|
Borrowed funds |
| $ | 222,350 |
|
| $ | 50,000 |
|
| $ | 49,000 |
|
| $ | 61,500 |
|
| $ | 69,000 |
|
Total shareholders' equity |
| $ | 126,087 |
|
| $ | 124,455 |
|
| $ | 115,868 |
|
| $ | 101,444 |
|
| $ | 89,516 |
|
Net loans to total deposits |
|
| 106.77 | % |
|
| 88.71 | % |
|
| 98.48 | % |
|
| 100.19 | % |
|
| 100.60 | % |
Common shares outstanding |
|
| 4,439,725 |
|
|
| 4,496,701 |
|
|
| 4,694,275 |
|
|
| 4,664,369 |
|
|
| 4,636,455 |
|
YTD BALANCE SHEET AVERAGES |
|
|
|
|
|
|
|
|
|
| ||||||||||
Total assets |
| $ | 1,523,419 |
|
| $ | 1,311,673 |
|
| $ | 1,200,605 |
|
| $ | 961,586 |
|
| $ | 844,673 |
|
Earning assets |
| $ | 1,429,605 |
|
| $ | 1,237,755 |
|
| $ | 1,147,570 |
|
| $ | 913,574 |
|
| $ | 796,283 |
|
Interest bearing liabilities |
| $ | 898,170 |
|
| $ | 754,622 |
|
| $ | 726,869 |
|
| $ | 612,549 |
|
| $ | 544,344 |
|
Total shareholders' equity |
| $ | 121,422 |
|
| $ | 122,629 |
|
| $ | 110,094 |
|
| $ | 96,358 |
|
| $ | 67,192 |
|
Total tangible shareholders' equity |
| $ | 111,548 |
|
| $ | 118,986 |
|
| $ | 106,140 |
|
| $ | 91,994 |
|
| $ | 62,329 |
|
Earned common shares outstanding |
|
| 4,422,791 |
|
|
| 4,603,259 |
|
|
| 4,669,979 |
|
|
| 4,643,955 |
|
|
| 3,811,677 |
|
Unvested stock grants |
|
| 25,212 |
|
|
| 20,984 |
|
|
| 14,027 |
|
|
| 9,917 |
|
|
| 756 |
|
Total common shares outstanding |
|
| 4,448,003 |
|
|
| 4,624,243 |
|
|
| 4,684,006 |
|
|
| 4,653,872 |
|
|
| 3,812,433 |
|
ASSET QUALITY |
|
|
|
|
|
|
|
|
|
| ||||||||||
Nonperforming loans to gross loans (1) |
|
| 0.16 | % |
|
| 0.18 | % |
|
| 0.75 | % |
|
| 0.17 | % |
|
| 0.14 | % |
Nonperforming assets to total assets (1) |
|
| 0.15 | % |
|
| 0.17 | % |
|
| 0.64 | % |
|
| 0.14 | % |
|
| 0.12 | % |
Allowance for loan losses to gross loans (1) |
|
| 0.91 | % |
|
| 0.95 | % |
|
| 1.02 | % |
|
| 0.67 | % |
|
| 0.58 | % |
Allowance for loan losses to gross loans, net of PPP loans (1) |
|
| 0.91 | % |
|
| 0.96 | % |
|
| 1.23 | % |
|
| 0.67 | % |
|
| 0.58 | % |
Net charge-offs (recoveries) to YTD average gross loans |
|
| 0.05 | % |
|
| 0.02 | % |
|
| 0.05 | % |
|
| — | % |
|
| 0.02 | % |
Provision for loan losses to YTD average gross loans |
|
| 0.25 | % |
| (0.02) % |
|
| 0.56 | % |
|
| 0.16 | % |
|
| 0.15 | % | ||
CAPITAL RATIOS(1) |
|
|
|
|
|
|
|
|
|
| ||||||||||
Total capital to risk weighted assets |
|
| 10.84 | % |
|
| 12.22 | % |
|
| 15.14 | % |
|
| 14.03 | % |
|
| 14.00 | % |
Tier 1 capital to risk weighted assets |
|
| 9.93 | % |
|
| 11.30 | % |
|
| 13.93 | % |
|
| 13.33 | % |
|
| 13.40 | % |
CET1 capital to risk weighted assets |
|
| 8.94 | % |
|
| 10.07 | % |
|
| 12.38 | % |
|
| 11.64 | % |
|
| 11.52 | % |
Tier 1 leverage ratio |
|
| 8.75 | % |
|
| 9.13 | % |
|
| 9.80 | % |
|
| 11.20 | % |
|
| 10.92 | % |
|
|
|
|
|
|
|
|
|
|
| ||||||||||
(1)At end of period |
|
|
|
|
|
|
|
|
|
| ||||||||||
Income Statement Breakdown and Analysis
|
| Quarter to Date | ||||||||||||||||||
|
| 12/31/2022 |
| 9/30/2022 |
| 6/30/2022 |
| 3/31/2022 |
| 12/31/2021 | ||||||||||
Net income |
| $ | 4,364 |
|
| $ | 4,009 |
|
| $ | 3,476 |
|
| $ | 3,084 |
|
| $ | 3,342 |
|
Acquisition related items (net of tax) |
|
|
|
|
|
|
|
|
|
| ||||||||||
Accretion on purchased loans |
|
| (20 | ) |
|
| (20 | ) |
|
| (20 | ) |
|
| (20 | ) |
|
| (154 | ) |
Amortization of core deposit intangibles |
|
| 85 |
|
|
| 85 |
|
|
| 85 |
|
|
| 85 |
|
|
| 54 |
|
Amortization on acquired time deposits |
|
| (21 | ) |
|
| (21 | ) |
|
| (21 | ) |
|
| (21 | ) |
|
| 2 |
|
Other acquisition related expenses |
|
| — |
|
|
| — |
|
|
| 11 |
|
|
| 202 |
|
|
| 178 |
|
Total acquisition related items (net of tax) |
|
| 44 |
|
|
| 44 |
|
|
| 55 |
|
|
| 246 |
|
|
| 80 |
|
Other nonrecurring items (net of tax) |
|
|
|
|
|
|
|
|
|
| ||||||||||
Prepayment penalties collected |
|
| (61 | ) |
|
| (119 | ) |
|
| (48 | ) |
|
| (162 | ) |
|
| (91 | ) |
Total other nonrecurring items (net of tax) |
|
| (61 | ) |
|
| (119 | ) |
|
| (48 | ) |
|
| (162 | ) |
|
| (91 | ) |
Adjusted net income from operations |
| $ | 4,347 |
|
| $ | 3,934 |
|
| $ | 3,483 |
|
| $ | 3,168 |
|
| $ | 3,331 |
|
|
|
|
|
|
|
|
|
|
|
| ||||||||||
Net interest income |
| $ | 14,137 |
|
| $ | 13,988 |
|
| $ | 12,626 |
|
| $ | 11,702 |
|
| $ | 11,104 |
|
Accretion on purchased loans |
|
| (25 | ) |
|
| (25 | ) |
|
| (26 | ) |
|
| (25 | ) |
|
| (195 | ) |
Prepayment penalties collected |
|
| (77 | ) |
|
| (150 | ) |
|
| (61 | ) |
|
| (205 | ) |
|
| (115 | ) |
Amortization on acquired time deposits |
|
| (27 | ) |
|
| (27 | ) |
|
| (26 | ) |
|
| (27 | ) |
|
| 3 |
|
Adjusted net interest income |
| $ | 14,008 |
|
| $ | 13,786 |
|
| $ | 12,513 |
|
| $ | 11,445 |
|
| $ | 10,797 |
|
|
|
|
|
|
|
|
|
|
|
| ||||||||||
PERFORMANCE RATIOS |
|
|
|
|
|
|
|
|
|
| ||||||||||
Based on adjusted net income from operations |
|
|
|
|
|
|
|
|
|
| ||||||||||
Earnings per share |
| $ | 0.98 |
|
| $ | 0.89 |
|
| $ | 0.79 |
|
| $ | 0.71 |
|
| $ | 0.74 |
|
Return on average assets |
|
| 1.05 | % |
|
| 1.00 | % |
|
| 0.96 | % |
|
| 0.89 | % |
|
| 0.98 | % |
Return on average shareholders' equity |
|
| 13.96 | % |
|
| 12.72 | % |
|
| 11.58 | % |
|
| 10.82 | % |
|
| 10.53 | % |
Return on average tangible shareholders' equity |
|
| 15.15 | % |
|
| 13.83 | % |
|
| 12.62 | % |
|
| 11.80 | % |
|
| 10.84 | % |
Efficiency ratio |
|
| 60.58 | % |
|
| 61.98 | % |
|
| 68.16 | % |
|
| 68.75 | % |
|
| 69.55 | % |
|
|
|
|
|
|
|
|
|
|
| ||||||||||
Based on adjusted net interest income |
|
|
|
|
|
|
|
|
|
| ||||||||||
Yield on earning assets (FTE) |
|
| 4.54 | % |
|
| 4.22 | % |
|
| 3.93 | % |
|
| 3.63 | % |
|
| 3.57 | % |
Rate on interest bearing liabilities |
|
| 1.41 | % |
|
| 0.74 | % |
|
| 0.37 | % |
|
| 0.28 | % |
|
| 0.33 | % |
Net interest margin to earning assets (FTE) |
|
| 3.60 | % |
|
| 3.74 | % |
|
| 3.70 | % |
|
| 3.44 | % |
|
| 3.37 | % |
|
|
|
|
|
|
|
|
|
|
| ||||||||||
|
| Year to Date December 31 |
| Variance | |||||||||||
|
|
| 2022 |
|
|
| 2021 |
|
| Amount |
| % | |||
Net income |
| $ | 14,933 |
|
| $ | 16,579 |
|
| $ | (1,646 | ) |
| (9.93)% | |
Acquisition related items (net of tax) |
|
|
|
|
|
|
|
| |||||||
Accretion on purchased loans |
|
| (80 | ) |
|
| (609 | ) |
|
| 529 |
|
| (86.86)% | |
Amortization of core deposit intangibles |
|
| 340 |
|
|
| 215 |
|
|
| 125 |
|
| 58.14 | % |
Amortization on acquired time deposits |
|
| (84 | ) |
|
| 8 |
|
|
| (92 | ) |
| (1,150.00)% | |
Other acquisition related expenses |
|
| 213 |
|
|
| 229 |
|
|
| (16 | ) |
| (6.99)% | |
Total acquisition related items (net of tax) |
|
| 389 |
|
|
| (157 | ) |
|
| 546 |
|
| (347.77)% | |
Other nonrecurring items (net of tax) |
|
|
|
|
|
|
|
| |||||||
Prepayment penalties collected |
|
| (390 | ) |
|
| (205 | ) |
|
| (185 | ) |
| 90.24 | % |
Total other nonrecurring items (net of tax) |
|
| (390 | ) |
|
| (205 | ) |
|
| (185 | ||||
