
 Yahoo Finance
 How Financially Strong Is Turners Automotive Group Limited (NZSE:TRA)?

Investors are always looking for growth in small-cap stocks like Turners Automotive Group Limited (NZSE:TRA), with a market cap of NZ$262.89m. However, an important fact which most ignore is: how financially healthy is the business? Companies operating in the Specialty Retail industry facing headwinds from current disruption, even ones that are profitable, are more likely to be higher risk. Assessing first and foremost the financial health is crucial. I believe these basic checks tell most of the story you need to know. Nevertheless, since I only look at basic financial figures, I suggest you dig deeper yourself into TRA here.
How much cash does TRA generate through its operations?
TRA’s debt levels surged from NZ$265.89m to NZ$317.37m over the last 12 months , which is made up of current and long term debt. With this rise in debt, TRA currently has NZ$36.02m remaining in cash and short-term investments , ready to deploy into the business. Moving onto cash from operations, its small level of operating cash flow means calculating cash-to-debt wouldn’t be too useful, though these low levels of cash means that operational efficiency is worth a look. As the purpose of this article is a high-level overview, I won’t be looking at this today, but you can assess some of TRA’s operating efficiency ratios such as ROA here.
Does TRA’s liquid assets cover its short-term commitments?
At the current liabilities level of NZ$5.14m liabilities, it seems that the business has been able to meet these commitments with a current assets level of NZ$440.24m, leading to a 85.65x current account ratio. Though, anything above 3x is considered high and could mean that TRA has too much idle capital in low-earning investments.
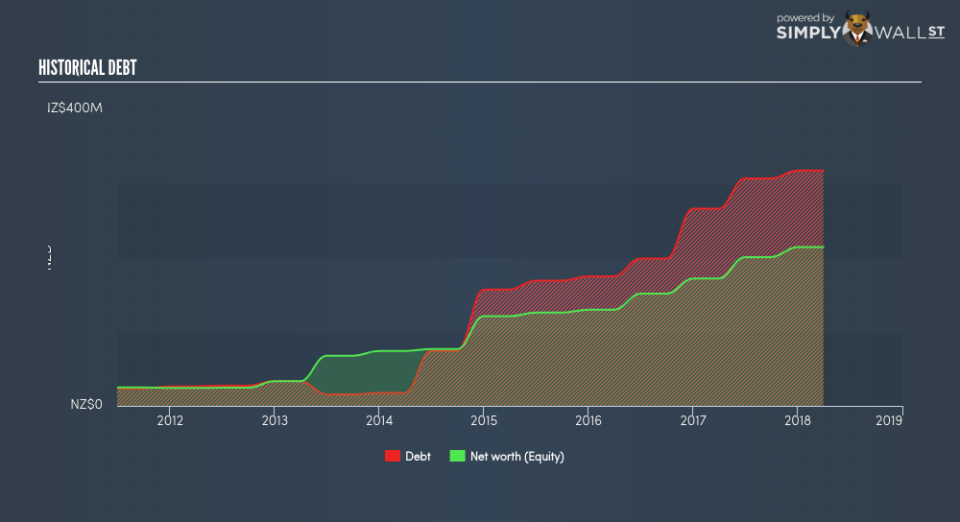
Is TRA’s debt level acceptable?
Since total debt levels have outpaced equities, TRA is a highly leveraged company. This is not uncommon for a small-cap company given that debt tends to be lower-cost and at times, more accessible. We can check to see whether TRA is able to meet its debt obligations by looking at the net interest coverage ratio. A company generating earnings before interest and tax (EBIT) at least three times its net interest payments is considered financially sound. In TRA’s, case, the ratio of 4.49x suggests that interest is appropriately covered, which means that lenders may be inclined to lend more money to the company, as it is seen as safe in terms of payback.
Next Steps:
At its current level of cash flow coverage, TRA has room for improvement to better cushion for events which may require debt repayment. However, the company will be able to pay all of its upcoming liabilities from its current short-term assets. Keep in mind I haven’t considered other factors such as how TRA has been performing in the past. I suggest you continue to research Turners Automotive Group to get a more holistic view of the stock by looking at:
Future Outlook: What are well-informed industry analysts predicting for TRA’s future growth? Take a look at our free research report of analyst consensus for TRA’s outlook.
Valuation: What is TRA worth today? Is the stock undervalued, even when its growth outlook is factored into its intrinsic value? The intrinsic value infographic in our free research report helps visualize whether TRA is currently mispriced by the market.
Other High-Performing Stocks: Are there other stocks that provide better prospects with proven track records? Explore our free list of these great stocks here.
To help readers see pass the short term volatility of the financial market, we aim to bring you a long-term focused research analysis purely driven by fundamental data. Note that our analysis does not factor in the latest price sensitive company announcements.
The author is an independent contributor and at the time of publication had no position in the stocks mentioned.
