
 Yahoo Finance
 Do Its Financials Have Any Role To Play In Driving Paramount Resources Ltd.'s (TSE:POU) Stock Up Recently?
Paramount Resources' (TSE:POU) stock is up by a considerable 5.3% over the past month. As most would know, fundamentals are what usually guide market price movements over the long-term, so we decided to look at the company's key financial indicators today to determine if they have any role to play in the recent price movement. In this article, we decided to focus on Paramount Resources' ROE.
ROE or return on equity is a useful tool to assess how effectively a company can generate returns on the investment it received from its shareholders. Put another way, it reveals the company's success at turning shareholder investments into profits.
See our latest analysis for Paramount Resources
How Is ROE Calculated?
Return on equity can be calculated by using the formula:
Return on Equity = Net Profit (from continuing operations) ÷ Shareholders' Equity
So, based on the above formula, the ROE for Paramount Resources is:
17% = CA$522m ÷ CA$3.1b (Based on the trailing twelve months to September 2022).
The 'return' is the profit over the last twelve months. So, this means that for every CA$1 of its shareholder's investments, the company generates a profit of CA$0.17.
What Is The Relationship Between ROE And Earnings Growth?
Thus far, we have learned that ROE measures how efficiently a company is generating its profits. Based on how much of its profits the company chooses to reinvest or "retain", we are then able to evaluate a company's future ability to generate profits. Generally speaking, other things being equal, firms with a high return on equity and profit retention, have a higher growth rate than firms that don’t share these attributes.
A Side By Side comparison of Paramount Resources' Earnings Growth And 17% ROE
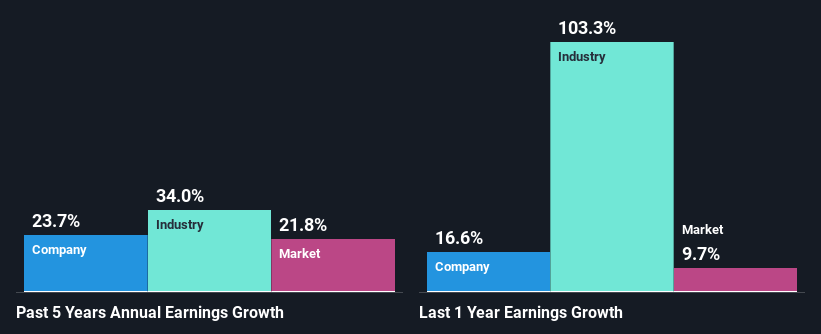
At first glance, Paramount Resources seems to have a decent ROE. Be that as it may, the company's ROE is still quite lower than the industry average of 27%. However, we are pleased to see the impressive 24% net income growth reported by Paramount Resources over the past five years. We believe that there might be other aspects that are positively influencing the company's earnings growth. Such as - high earnings retention or an efficient management in place. However, not to forget, the company does have a decent ROE to begin with, just that it is lower than the industry average. So this certainly also provides some context to the high earnings growth seen by the company.
As a next step, we compared Paramount Resources' net income growth with the industry and were disappointed to see that the company's growth is lower than the industry average growth of 34% in the same period.
Earnings growth is an important metric to consider when valuing a stock. It’s important for an investor to know whether the market has priced in the company's expected earnings growth (or decline). Doing so will help them establish if the stock's future looks promising or ominous. What is POU worth today? The intrinsic value infographic in our free research report helps visualize whether POU is currently mispriced by the market.
Is Paramount Resources Using Its Retained Earnings Effectively?
Paramount Resources has a really low three-year median payout ratio of 14%, meaning that it has the remaining 86% left over to reinvest into its business. This suggests that the management is reinvesting most of the profits to grow the business as evidenced by the growth seen by the company.
While Paramount Resources has seen growth in its earnings, it only recently started to pay a dividend. It is most likely that the company decided to impress new and existing shareholders with a dividend. Upon studying the latest analysts' consensus data, we found that the company's future payout ratio is expected to rise to 42% over the next three years. Despite the higher expected payout ratio, the company's ROE is not expected to change by much.
Conclusion
On the whole, we do feel that Paramount Resources has some positive attributes. Particularly, its earnings have grown respectably as we saw earlier, which was likely achieved due to the company reinvesting most of its earnings at a decent rate of return, to grow its business. While we won't completely dismiss the company, what we would do, is try to ascertain how risky the business is to make a more informed decision around the company. You can see the 3 risks we have identified for Paramount Resources by visiting our risks dashboard for free on our platform here.
Have feedback on this article? Concerned about the content? Get in touch with us directly. Alternatively, email editorial-team (at) simplywallst.com.
This article by Simply Wall St is general in nature. We provide commentary based on historical data and analyst forecasts only using an unbiased methodology and our articles are not intended to be financial advice. It does not constitute a recommendation to buy or sell any stock, and does not take account of your objectives, or your financial situation. We aim to bring you long-term focused analysis driven by fundamental data. Note that our analysis may not factor in the latest price-sensitive company announcements or qualitative material. Simply Wall St has no position in any stocks mentioned.
Join A Paid User Research Session
You’ll receive a US$30 Amazon Gift card for 1 hour of your time while helping us build better investing tools for the individual investors like yourself. Sign up here
