
 Yahoo Finance
 Should First Sponsor Group (SGX:ADN) Be Disappointed With Their 17% Profit?

Want to participate in a short research study? Help shape the future of investing tools and you could win a $250 gift card!
One simple way to benefit from the stock market is to buy an index fund. But if you buy good businesses at attractive prices, your portfolio returns could exceed the average market return. Just take a look at First Sponsor Group Limited (SGX:ADN), which is up 17%, over three years, soundly beating the market return of 8.9% (not including dividends). However, more recent returns haven't been as impressive as that, with the stock returning just 5.9% in the last year, including dividends.
View our latest analysis for First Sponsor Group
While the efficient markets hypothesis continues to be taught by some, it has been proven that markets are over-reactive dynamic systems, and investors are not always rational. One flawed but reasonable way to assess how sentiment around a company has changed is to compare the earnings per share (EPS) with the share price.
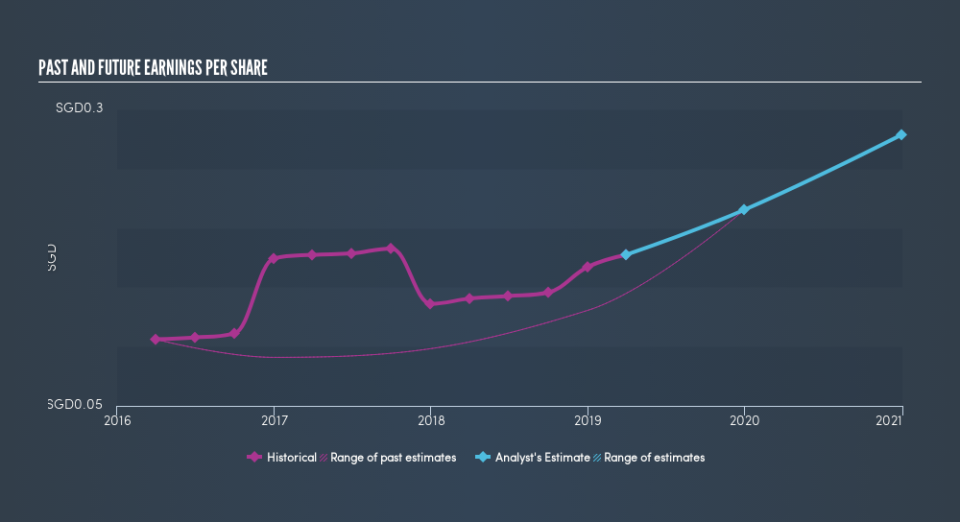
First Sponsor Group was able to grow its EPS at 19% per year over three years, sending the share price higher. The average annual share price increase of 5.4% is actually lower than the EPS growth. Therefore, it seems the market has moderated its expectations for growth, somewhat. We'd venture the lowish P/E ratio of 7.38 also reflects the negative sentiment around the stock.
You can see how EPS has changed over time in the image below (click on the chart to see the exact values).
It's good to see that there was some significant insider buying in the last three months. That's a positive. On the other hand, we think the revenue and earnings trends are much more meaningful measures of the business. Dive deeper into the earnings by checking this interactive graph of First Sponsor Group's earnings, revenue and cash flow.
What About Dividends?
As well as measuring the share price return, investors should also consider the total shareholder return (TSR). The TSR is a return calculation that accounts for the value of cash dividends (assuming that any dividend received was reinvested) and the calculated value of any discounted capital raisings and spin-offs. Arguably, the TSR gives a more comprehensive picture of the return generated by a stock. As it happens, First Sponsor Group's TSR for the last 3 years was 23%, which exceeds the share price return mentioned earlier. The dividends paid by the company have thusly boosted the total shareholder return.
A Different Perspective
First Sponsor Group shareholders have received returns of 5.9% over twelve months (even including dividends), which isn't far from the general market return. Most would be happy with a gain, and it helps that the year's return is actually better than the average return over five years, which was 2.2%. Even if the share price growth slows down from here, there's a good chance that this is business worth watching in the long term. If you want to research this stock further, the data on insider buying is an obvious place to start. You can click here to see who has been buying shares - and the price they paid.
If you like to buy stocks alongside management, then you might just love this free list of companies. (Hint: insiders have been buying them).
Please note, the market returns quoted in this article reflect the market weighted average returns of stocks that currently trade on SG exchanges.
We aim to bring you long-term focused research analysis driven by fundamental data. Note that our analysis may not factor in the latest price-sensitive company announcements or qualitative material.
If you spot an error that warrants correction, please contact the editor at editorial-team@simplywallst.com. This article by Simply Wall St is general in nature. It does not constitute a recommendation to buy or sell any stock, and does not take account of your objectives, or your financial situation. Simply Wall St has no position in the stocks mentioned. Thank you for reading.
