
 Yahoo Finance
 Is Fisher & Paykel Healthcare Corporation Limited (NZSE:FPH) As Strong As Its Balance Sheet Indicates?

Mid-caps stocks, like Fisher & Paykel Healthcare Corporation Limited (NZSE:FPH) with a market capitalization of NZ$7.6b, aren’t the focus of most investors who prefer to direct their investments towards either large-cap or small-cap stocks. However, history shows that overlooked mid-cap companies have performed better on a risk-adjusted manner than the smaller and larger segment of the market. Today we will look at FPH’s financial liquidity and debt levels, which are strong indicators for whether the company can weather economic downturns or fund strategic acquisitions for future growth. Note that this commentary is very high-level and solely focused on financial health, so I suggest you dig deeper yourself into FPH here.
View our latest analysis for Fisher & Paykel Healthcare
How does FPH’s operating cash flow stack up against its debt?
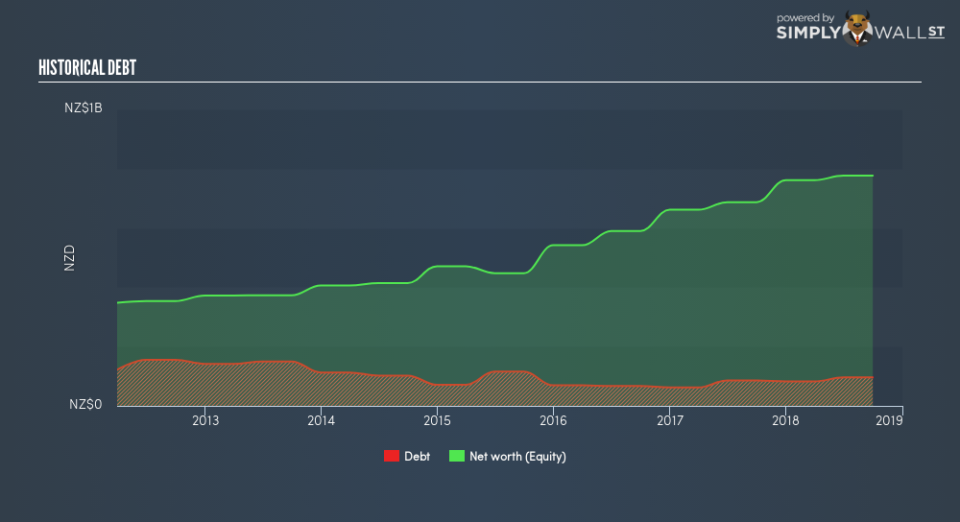
FPH’s debt levels surged from NZ$86m to NZ$96m over the last 12 months , which includes long-term debt. With this rise in debt, the current cash and short-term investment levels stands at NZ$111m , ready to deploy into the business. Moreover, FPH has produced NZ$259m in operating cash flow during the same period of time, resulting in an operating cash to total debt ratio of 270%, indicating that FPH’s operating cash is sufficient to cover its debt. This ratio can also be a sign of operational efficiency as an alternative to return on assets. In FPH’s case, it is able to generate 2.7x cash from its debt capital.
Does FPH’s liquid assets cover its short-term commitments?
With current liabilities at NZ$196m, it appears that the company has maintained a safe level of current assets to meet its obligations, with the current ratio last standing at 2.08x. Generally, for Medical Equipment companies, this is a reasonable ratio as there’s enough of a cash buffer without holding too much capital in low return investments.
Is FPH’s debt level acceptable?
FPH’s level of debt is appropriate relative to its total equity, at 12%. This range is considered safe as FPH is not taking on too much debt obligation, which can be restrictive and risky for equity-holders. We can test if FPH’s debt levels are sustainable by measuring interest payments against earnings of a company. Ideally, earnings before interest and tax (EBIT) should cover net interest by at least three times. For FPH, the ratio of 420x suggests that interest is comfortably covered, which means that debtors may be willing to loan the company more money, giving FPH ample headroom to grow its debt facilities.
Next Steps:
FPH’s high cash coverage and low debt levels indicate its ability to utilise its borrowings efficiently in order to generate ample cash flow. Furthermore, the company will be able to pay all of its upcoming liabilities from its current short-term assets. I admit this is a fairly basic analysis for FPH’s financial health. Other important fundamentals need to be considered alongside. I recommend you continue to research Fisher & Paykel Healthcare to get a better picture of the stock by looking at:
Future Outlook: What are well-informed industry analysts predicting for FPH’s future growth? Take a look at our free research report of analyst consensus for FPH’s outlook.
Valuation: What is FPH worth today? Is the stock undervalued, even when its growth outlook is factored into its intrinsic value? The intrinsic value infographic in our free research report helps visualize whether FPH is currently mispriced by the market.
Other High-Performing Stocks: Are there other stocks that provide better prospects with proven track records? Explore our free list of these great stocks here.
To help readers see past the short term volatility of the financial market, we aim to bring you a long-term focused research analysis purely driven by fundamental data. Note that our analysis does not factor in the latest price-sensitive company announcements.
The author is an independent contributor and at the time of publication had no position in the stocks mentioned. For errors that warrant correction please contact the editor at editorial-team@simplywallst.com.
