
 Yahoo Finance
 Here’s What Fisher & Paykel Healthcare Corporation Limited’s (NZSE:FPH) ROCE Can Tell Us

Today we are going to look at Fisher & Paykel Healthcare Corporation Limited (NZSE:FPH) to see whether it might be an attractive investment prospect. Specifically, we’ll consider its Return On Capital Employed (ROCE), since that will give us an insight into how efficiently the business can generate profits from the capital it requires.
First up, we’ll look at what ROCE is and how we calculate it. Then we’ll compare its ROCE to similar companies. And finally, we’ll look at how its current liabilities are impacting its ROCE.
Understanding Return On Capital Employed (ROCE)
ROCE is a measure of a company’s yearly pre-tax profit (its return), relative to the capital employed in the business. In general, businesses with a higher ROCE are usually better quality. Overall, it is a valuable metric that has its flaws. Author Edwin Whiting says to be careful when comparing the ROCE of different businesses, since ‘No two businesses are exactly alike.’
How Do You Calculate Return On Capital Employed?
The formula for calculating the return on capital employed is:
Return on Capital Employed = Earnings Before Interest and Tax (EBIT) ÷ (Total Assets – Current Liabilities)
Or for Fisher & Paykel Healthcare:
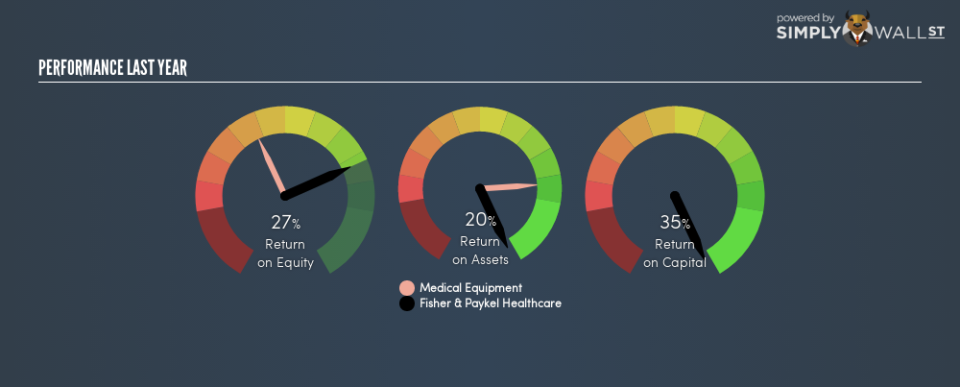
0.35 = NZ$270m ÷ (NZ$1.0b – NZ$196m) (Based on the trailing twelve months to September 2018.)
Therefore, Fisher & Paykel Healthcare has an ROCE of 35%.
See our latest analysis for Fisher & Paykel Healthcare
Want to help shape the future of investing tools and platforms? Take the survey and be part of one of the most advanced studies of stock market investors to date.
Does Fisher & Paykel Healthcare Have A Good ROCE?
ROCE can be useful when making comparisons, such as between similar companies. Fisher & Paykel Healthcare’s ROCE appears to be substantially greater than the 14% average in the Medical Equipment industry. We consider this a positive sign, because it suggests it uses capital more efficiently than similar companies. Putting aside its position relative to its industry for now, in absolute terms, Fisher & Paykel Healthcare’s ROCE is currently very good.
When considering ROCE, bear in mind that it reflects the past and does not necessarily predict the future. Companies in cyclical industries can be difficult to understand using ROCE, as returns typically look high during boom times, and low during busts. This is because ROCE only looks at one year, instead of considering returns across a whole cycle. What happens in the future is pretty important for investors, so we have prepared a free report on analyst forecasts for Fisher & Paykel Healthcare.
Do Fisher & Paykel Healthcare’s Current Liabilities Skew Its ROCE?
Current liabilities include invoices, such as supplier payments, short-term debt, or a tax bill, that need to be paid within 12 months. The ROCE equation subtracts current liabilities from capital employed, so a company with a lot of current liabilities appears to have less capital employed, and a higher ROCE than otherwise. To check the impact of this, we calculate if a company has high current liabilities relative to its total assets.
Fisher & Paykel Healthcare has total assets of NZ$1.0b and current liabilities of NZ$196m. Therefore its current liabilities are equivalent to approximately 19% of its total assets. The fairly low level of current liabilities won’t have much impact on the already great ROCE.
What We Can Learn From Fisher & Paykel Healthcare’s ROCE
This is good to see, and with such a high ROCE, Fisher & Paykel Healthcare may be worth a closer look. Of course you might be able to find a better stock than Fisher & Paykel Healthcare. So you may wish to see this free collection of other companies that have grown earnings strongly.
For those who like to find winning investments this free list of growing companies with recent insider purchasing, could be just the ticket.
To help readers see past the short term volatility of the financial market, we aim to bring you a long-term focused research analysis purely driven by fundamental data. Note that our analysis does not factor in the latest price-sensitive company announcements.
The author is an independent contributor and at the time of publication had no position in the stocks mentioned. For errors that warrant correction please contact the editor at editorial-team@simplywallst.com.
