
 Yahoo Finance
 The five-year shareholder returns and company earnings persist lower as OceanaGold (TSE:OGC) stock falls a further 9.2% in past week
For many, the main point of investing is to generate higher returns than the overall market. But in any portfolio, there will be mixed results between individual stocks. So we wouldn't blame long term OceanaGold Corporation (TSE:OGC) shareholders for doubting their decision to hold, with the stock down 35% over a half decade. Unfortunately the share price momentum is still quite negative, with prices down 15% in thirty days. However, we note the price may have been impacted by the broader market, which is down 7.0% in the same time period.
With the stock having lost 9.2% in the past week, it's worth taking a look at business performance and seeing if there's any red flags.
See our latest analysis for OceanaGold
While the efficient markets hypothesis continues to be taught by some, it has been proven that markets are over-reactive dynamic systems, and investors are not always rational. By comparing earnings per share (EPS) and share price changes over time, we can get a feel for how investor attitudes to a company have morphed over time.
OceanaGold became profitable within the last five years. Most would consider that to be a good thing, so it's counter-intuitive to see the share price declining. Other metrics may better explain the share price move.
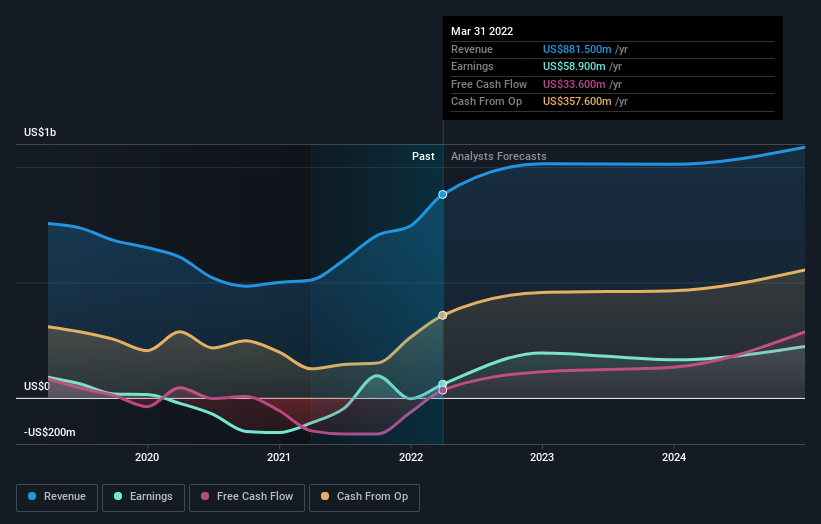
The revenue decline of 1.7% isn't too bad. But if the market expected durable top line growth, then that could explain the share price weakness.
The image below shows how earnings and revenue have tracked over time (if you click on the image you can see greater detail).
It's good to see that there was some significant insider buying in the last three months. That's a positive. On the other hand, we think the revenue and earnings trends are much more meaningful measures of the business. So it makes a lot of sense to check out what analysts think OceanaGold will earn in the future (free profit forecasts).
A Different Perspective
It's good to see that OceanaGold has rewarded shareholders with a total shareholder return of 5.8% in the last twelve months. That certainly beats the loss of about 6% per year over the last half decade. This makes us a little wary, but the business might have turned around its fortunes. I find it very interesting to look at share price over the long term as a proxy for business performance. But to truly gain insight, we need to consider other information, too. Take risks, for example - OceanaGold has 1 warning sign we think you should be aware of.
OceanaGold is not the only stock insiders are buying. So take a peek at this free list of growing companies with insider buying.
Please note, the market returns quoted in this article reflect the market weighted average returns of stocks that currently trade on CA exchanges.
Have feedback on this article? Concerned about the content? Get in touch with us directly. Alternatively, email editorial-team (at) simplywallst.com.
This article by Simply Wall St is general in nature. We provide commentary based on historical data and analyst forecasts only using an unbiased methodology and our articles are not intended to be financial advice. It does not constitute a recommendation to buy or sell any stock, and does not take account of your objectives, or your financial situation. We aim to bring you long-term focused analysis driven by fundamental data. Note that our analysis may not factor in the latest price-sensitive company announcements or qualitative material. Simply Wall St has no position in any stocks mentioned.
