
 Yahoo Finance
 Is Fortescue Metals Group Limited (ASX:FMG) A Smart Pick For Income Investors?

Could Fortescue Metals Group Limited (ASX:FMG) be an attractive dividend share to own for the long haul? Investors are often drawn to strong companies with the idea of reinvesting the dividends. If you are hoping to live on your dividends, it's important to be more stringent with your investments than the average punter. Regular readers know we like to apply the same approach to each dividend stock, and we hope you'll find our analysis useful.
In this case, Fortescue Metals Group likely looks attractive to dividend investors, given its 3.4% dividend yield and nine-year payment history. We'd agree the yield does look enticing. Remember though, due to the recent spike in its share price, Fortescue Metals Group's yield will look lower, even though the market may now be factoring in an improvement in its long-term prospects. When buying stocks for their dividends, you should always run through the checks below, to see if the dividend looks sustainable.
Explore this interactive chart for our latest analysis on Fortescue Metals Group!
Payout ratios
Dividends are usually paid out of company earnings. If a company is paying more than it earns, then the dividend might become unsustainable - hardly an ideal situation. Comparing dividend payments to a company's net profit after tax is a simple way of reality-checking whether a dividend is sustainable. In the last year, Fortescue Metals Group paid out 29% of its profit as dividends. This is a medium payout level that leaves enough capital in the business to fund opportunities that might arise, while also rewarding shareholders. One of the risks is that management reinvests the retained capital poorly instead of paying a higher dividend.
Another important check we do is to see if the free cash flow generated is sufficient to pay the dividend. Fortescue Metals Group paid out 60% of its free cash flow last year, which is acceptable, but is starting to limit the amount of earnings that can be reinvested into the business. It's encouraging to see that the dividend is covered by both profit and cash flow. This generally suggests the dividend is sustainable, as long as earnings don't drop precipitously.
We update our data on Fortescue Metals Group every 24 hours, so you can always get our latest analysis of its financial health, here.
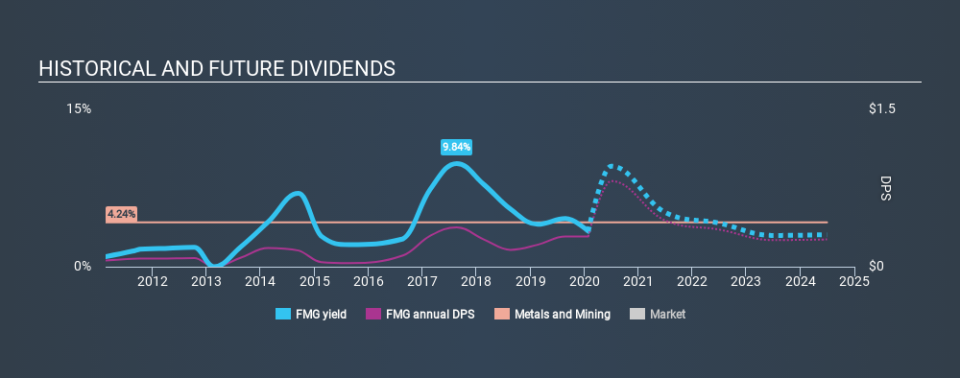
Dividend Volatility
Before buying a stock for its income, we want to see if the dividends have been stable in the past, and if the company has a track record of maintaining its dividend. Looking at the last decade of data, we can see that Fortescue Metals Group paid its first dividend at least nine years ago. Although it has been paying a dividend for several years now, the dividend has been cut at least once, and we're cautious about the consistency of its dividend across a full economic cycle. During the past nine-year period, the first annual payment was US$0.059 in 2011, compared to US$0.29 last year. Dividends per share have grown at approximately 19% per year over this time. The dividends haven't grown at precisely 19% every year, but this is a useful way to average out the historical rate of growth.
So, its dividends have grown at a rapid rate over this time, but payments have been cut in the past. The stock may still be worth considering as part of a diversified dividend portfolio.
Dividend Growth Potential
With a relatively unstable dividend, it's even more important to evaluate if earnings per share (EPS) are growing - it's not worth taking the risk on a dividend getting cut, unless you might be rewarded with larger dividends in future. Fortescue Metals Group has grown its earnings per share at 3.3% per annum over the past five years. A payout ratio below 50% leaves ample room to reinvest in the business, and provides finanical flexibility. Earnings per share growth have grown slowly, which is not great, but if the retained earnings can be reinvested effectively, future growth may be stronger.
Conclusion
To summarise, shareholders should always check that Fortescue Metals Group's dividends are affordable, that its dividend payments are relatively stable, and that it has decent prospects for growing its earnings and dividend. Firstly, we like that Fortescue Metals Group pays out a low fraction of earnings. It pays out a higher percentage of its cashflow, although this is within acceptable bounds. Second, earnings growth has been ordinary, and its history of dividend payments is chequered - having cut its dividend at least once in the past. In sum, we find it hard to get excited about Fortescue Metals Group from a dividend perspective. It's not that we think it's a bad business; just that there are other companies that perform better on these criteria.
Earnings growth generally bodes well for the future value of company dividend payments. See if the 13 Fortescue Metals Group analysts we track are forecasting continued growth with our free report on analyst estimates for the company.
Looking for more high-yielding dividend ideas? Try our curated list of dividend stocks with a yield above 3%.
If you spot an error that warrants correction, please contact the editor at editorial-team@simplywallst.com. This article by Simply Wall St is general in nature. It does not constitute a recommendation to buy or sell any stock, and does not take account of your objectives, or your financial situation. Simply Wall St has no position in the stocks mentioned.
We aim to bring you long-term focused research analysis driven by fundamental data. Note that our analysis may not factor in the latest price-sensitive company announcements or qualitative material. Thank you for reading.
