
 Yahoo Finance
 Freightways Limited's (NZSE:FRE) Stock Has Shown Weakness Lately But Financial Prospects Look Decent: Is The Market Wrong?
Freightways (NZSE:FRE) has had a rough three months with its share price down 27%. But if you pay close attention, you might find that its key financial indicators look quite decent, which could mean that the stock could potentially rise in the long-term given how markets usually reward more resilient long-term fundamentals. In this article, we decided to focus on Freightways' ROE.
Return on Equity or ROE is a test of how effectively a company is growing its value and managing investors’ money. In simpler terms, it measures the profitability of a company in relation to shareholder's equity.
Check out our latest analysis for Freightways
How Do You Calculate Return On Equity?
The formula for return on equity is:
Return on Equity = Net Profit (from continuing operations) ÷ Shareholders' Equity
So, based on the above formula, the ROE for Freightways is:
20% = NZ$72m ÷ NZ$354m (Based on the trailing twelve months to December 2021).
The 'return' is the income the business earned over the last year. That means that for every NZ$1 worth of shareholders' equity, the company generated NZ$0.20 in profit.
Why Is ROE Important For Earnings Growth?
So far, we've learned that ROE is a measure of a company's profitability. We now need to evaluate how much profit the company reinvests or "retains" for future growth which then gives us an idea about the growth potential of the company. Assuming all else is equal, companies that have both a higher return on equity and higher profit retention are usually the ones that have a higher growth rate when compared to companies that don't have the same features.
A Side By Side comparison of Freightways' Earnings Growth And 20% ROE
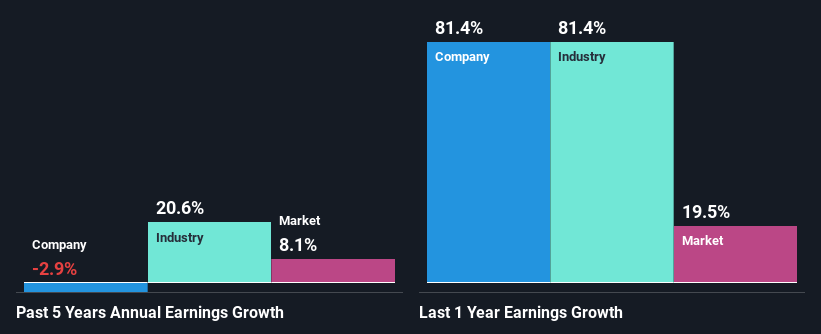
At first glance, Freightways seems to have a decent ROE. Especially when compared to the industry average of 12% the company's ROE looks pretty impressive. Needless to say, we are quite surprised to see that Freightways' net income shrunk at a rate of 2.9% over the past five years. Based on this, we feel that there might be other reasons which haven't been discussed so far in this article that could be hampering the company's growth. Such as, the company pays out a huge portion of its earnings as dividends, or is faced with competitive pressures.
So, as a next step, we compared Freightways' performance against the industry and were disappointed to discover that while the company has been shrinking its earnings, the industry has been growing its earnings at a rate of 16% in the same period.
Earnings growth is an important metric to consider when valuing a stock. The investor should try to establish if the expected growth or decline in earnings, whichever the case may be, is priced in. By doing so, they will have an idea if the stock is headed into clear blue waters or if swampy waters await. Has the market priced in the future outlook for FRE? You can find out in our latest intrinsic value infographic research report.
Is Freightways Using Its Retained Earnings Effectively?
Freightways' declining earnings is not surprising given how the company is spending most of its profits in paying dividends, judging by its three-year median payout ratio of 75% (or a retention ratio of 25%). The business is only left with a small pool of capital to reinvest - A vicious cycle that doesn't benefit the company in the long-run. You can see the 3 risks we have identified for Freightways by visiting our risks dashboard for free on our platform here.
Additionally, Freightways has paid dividends over a period of at least ten years, which means that the company's management is determined to pay dividends even if it means little to no earnings growth. Our latest analyst data shows that the future payout ratio of the company over the next three years is expected to be approximately 76%. However, Freightways' ROE is predicted to rise to 28% despite there being no anticipated change in its payout ratio.
Conclusion
In total, it does look like Freightways has some positive aspects to its business. Yet, the low earnings growth is a bit concerning, especially given that the company has a high rate of return. Investors could have benefitted from the high ROE, had the company been reinvesting more of its earnings. As discussed earlier, the company is retaining a small portion of its profits. Having said that, looking at current analyst estimates, we found that the company's earnings growth rate is expected to see a huge improvement. Are these analysts expectations based on the broad expectations for the industry, or on the company's fundamentals? Click here to be taken to our analyst's forecasts page for the company.
Have feedback on this article? Concerned about the content? Get in touch with us directly. Alternatively, email editorial-team (at) simplywallst.com.
This article by Simply Wall St is general in nature. We provide commentary based on historical data and analyst forecasts only using an unbiased methodology and our articles are not intended to be financial advice. It does not constitute a recommendation to buy or sell any stock, and does not take account of your objectives, or your financial situation. We aim to bring you long-term focused analysis driven by fundamental data. Note that our analysis may not factor in the latest price-sensitive company announcements or qualitative material. Simply Wall St has no position in any stocks mentioned.
