
 Yahoo Finance
 Are Gencor Industries, Inc.'s (NASDAQ:GENC) Mixed Financials The Reason For Its Gloomy Performance on The Stock Market?
Gencor Industries (NASDAQ:GENC) has had a rough three months with its share price down 2.8%. It is possible that the markets have ignored the company's differing financials and decided to lean-in to the negative sentiment. Stock prices are usually driven by a company’s financial performance over the long term, and therefore we decided to pay more attention to the company's financial performance. In this article, we decided to focus on Gencor Industries' ROE.
ROE or return on equity is a useful tool to assess how effectively a company can generate returns on the investment it received from its shareholders. In simpler terms, it measures the profitability of a company in relation to shareholder's equity.
See our latest analysis for Gencor Industries
How Is ROE Calculated?
The formula for ROE is:
Return on Equity = Net Profit (from continuing operations) ÷ Shareholders' Equity
So, based on the above formula, the ROE for Gencor Industries is:
1.3% = US$2.1m ÷ US$167m (Based on the trailing twelve months to March 2022).
The 'return' is the yearly profit. So, this means that for every $1 of its shareholder's investments, the company generates a profit of $0.01.
What Has ROE Got To Do With Earnings Growth?
Thus far, we have learned that ROE measures how efficiently a company is generating its profits. We now need to evaluate how much profit the company reinvests or "retains" for future growth which then gives us an idea about the growth potential of the company. Generally speaking, other things being equal, firms with a high return on equity and profit retention, have a higher growth rate than firms that don’t share these attributes.
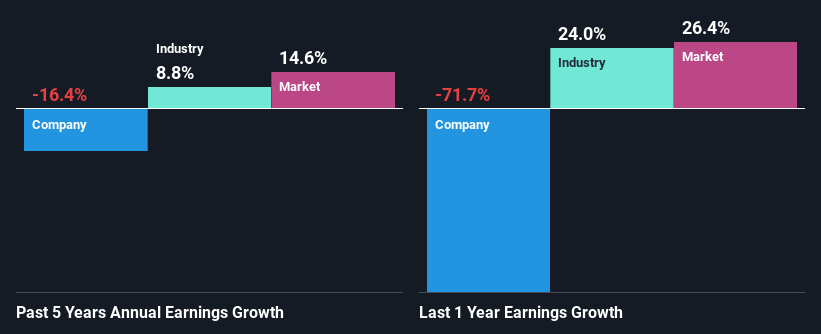
A Side By Side comparison of Gencor Industries' Earnings Growth And 1.3% ROE
As you can see, Gencor Industries' ROE looks pretty weak. Even compared to the average industry ROE of 12%, the company's ROE is quite dismal. Therefore, it might not be wrong to say that the five year net income decline of 16% seen by Gencor Industries was possibly a result of it having a lower ROE. We believe that there also might be other aspects that are negatively influencing the company's earnings prospects. Such as - low earnings retention or poor allocation of capital.
That being said, we compared Gencor Industries' performance with the industry and were concerned when we found that while the company has shrunk its earnings, the industry has grown its earnings at a rate of 8.8% in the same period.
Earnings growth is a huge factor in stock valuation. It’s important for an investor to know whether the market has priced in the company's expected earnings growth (or decline). This then helps them determine if the stock is placed for a bright or bleak future. Is Gencor Industries fairly valued compared to other companies? These 3 valuation measures might help you decide.
Is Gencor Industries Efficiently Re-investing Its Profits?
Because Gencor Industries doesn't pay any dividends, we infer that it is retaining all of its profits, which is rather perplexing when you consider the fact that there is no earnings growth to show for it. It looks like there might be some other reasons to explain the lack in that respect. For example, the business could be in decline.
Conclusion
On the whole, we feel that the performance shown by Gencor Industries can be open to many interpretations. Even though it appears to be retaining most of its profits, given the low ROE, investors may not be benefitting from all that reinvestment after all. The low earnings growth suggests our theory correct. Wrapping up, we would proceed with caution with this company and one way of doing that would be to look at the risk profile of the business. You can see the 2 risks we have identified for Gencor Industries by visiting our risks dashboard for free on our platform here.
Have feedback on this article? Concerned about the content? Get in touch with us directly. Alternatively, email editorial-team (at) simplywallst.com.
This article by Simply Wall St is general in nature. We provide commentary based on historical data and analyst forecasts only using an unbiased methodology and our articles are not intended to be financial advice. It does not constitute a recommendation to buy or sell any stock, and does not take account of your objectives, or your financial situation. We aim to bring you long-term focused analysis driven by fundamental data. Note that our analysis may not factor in the latest price-sensitive company announcements or qualitative material. Simply Wall St has no position in any stocks mentioned.
