
 Yahoo Finance
 General Electric Company (NYSE:GE): Time For A Financial Health Check

The size of General Electric Company (NYSE:GE), a US$115.51B large-cap, often attracts investors seeking a reliable investment in the stock market. Risk-averse investors who are attracted to diversified streams of revenue and strong capital returns tend to seek out these large companies. But, the key to their continued success lies in its financial health. This article will examine General Electric’s financial liquidity and debt levels to get an idea of whether the company can deal with cyclical downturns and maintain funds to accommodate strategic spending for future growth. Remember this is a very top-level look that focuses exclusively on financial health, so I recommend a deeper analysis into GE here. See our latest analysis for General Electric
Does GE produce enough cash relative to debt?
GE has sustained its debt level by about US$134.59B over the last 12 months comprising of short- and long-term debt. At this current level of debt, GE currently has US$18.21B remaining in cash and short-term investments for investing into the business. Moreover, GE has produced cash from operations of US$10.43B in the last twelve months, resulting in an operating cash to total debt ratio of 7.75%, meaning that GE’s debt is not appropriately covered by operating cash. This ratio can also be a sign of operational efficiency for unprofitable companies as traditional metrics such as return on asset (ROA) requires a positive net income. In GE’s case, it is able to generate 0.077x cash from its debt capital.
Can GE meet its short-term obligations with the cash in hand?
With current liabilities at US$61.89B, it seems that the business has been able to meet these commitments with a current assets level of US$140.11B, leading to a 2.26x current account ratio. For Industrials companies, this ratio is within a sensible range as there’s enough of a cash buffer without holding too capital in low return investments.
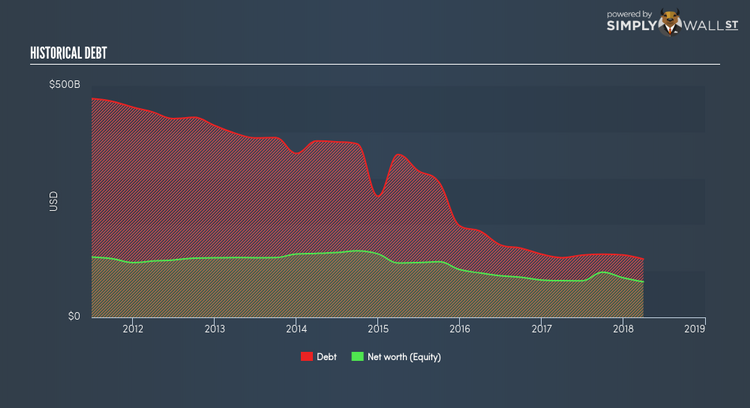
Can GE service its debt comfortably?
Since equity is smaller than total debt levels, General Electric is considered to have high leverage. This is common amongst large-cap companies because debt can often be a less expensive alternative to equity due to tax deductibility of interest payments. Since large-caps are seen as safer than their smaller constituents, they tend to enjoy lower cost of capital. But since GE is presently loss-making, sustainability of its current state of operations becomes a concern. Maintaining a high level of debt, while revenues are still below costs, can be dangerous as liquidity tends to dry up in unexpected downturns.
Next Steps:
At its current level of cash flow coverage, GE has room for improvement to better cushion for events which may require debt repayment. However, the company exhibits proper management of current assets and upcoming liabilities. This is only a rough assessment of financial health, and I’m sure GE has company-specific issues impacting its capital structure decisions. I recommend you continue to research General Electric to get a more holistic view of the stock by looking at:
Future Outlook: What are well-informed industry analysts predicting for GE’s future growth? Take a look at our free research report of analyst consensus for GE’s outlook.
Valuation: What is GE worth today? Is the stock undervalued, even when its growth outlook is factored into its intrinsic value? The intrinsic value infographic in our free research report helps visualize whether GE is currently mispriced by the market.
Other High-Performing Stocks: Are there other stocks that provide better prospects with proven track records? Explore our free list of these great stocks here.
To help readers see pass the short term volatility of the financial market, we aim to bring you a long-term focused research analysis purely driven by fundamental data. Note that our analysis does not factor in the latest price sensitive company announcements.
The author is an independent contributor and at the time of publication had no position in the stocks mentioned.
