
 Yahoo Finance
 Gold and Crude Oil Consolidate After Suffering Deep Losses
DailyFX.com -
Talking Points:
US Dollar Extends Recovery for Fourth Consecutive Day
S&P 500 Digesting Gains After Setting New Record High
Gold, Crude Oil Prices Stall After Suffering Large Losses
Can’t access the Dow Jones FXCM US Dollar Index? Try the USD basket on Mirror Trader. **
US DOLLAR TECHNICAL ANALYSIS – Prices advanced for a fourth consecutive day but failed to clear a near-term upside chart barrier. Near-term resistance is at 11836, the 38.2% Fibonacci retracement, with a break above that on a daily closing basis exposing the 50% level at 11898. Alternatively, a turn back below the 11748-59 area (range support, 23.6% Fib) clears the way for a test of the 14.6% retracement at 11711.

Daily Chart - Created Using FXCM Marketscope
** The Dow Jones FXCM US Dollar Index and the Mirror Trader USD basket are not the same product.
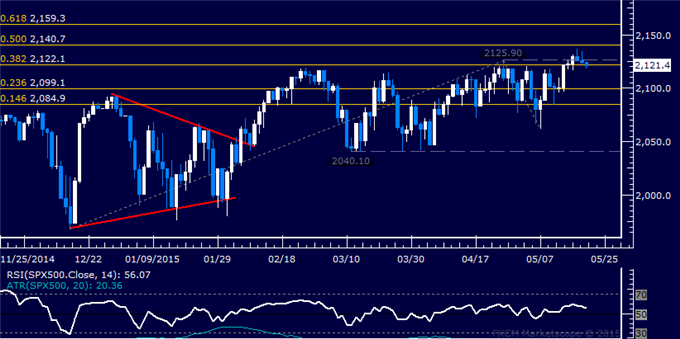
S&P 500 TECHNICAL ANALYSIS – Prices are consolidating after breaking range resistance and setting a new record high. From here, a daily close above the 50% Fibonacci expansion at 2140.70 exposes the 61.8% level at 2159.30. Alternatively, a move back below the 38.2% Fib at 2122.10 targets the 23.6% expansion at 2099.10.
Daily Chart - Created Using FXCM Marketscope
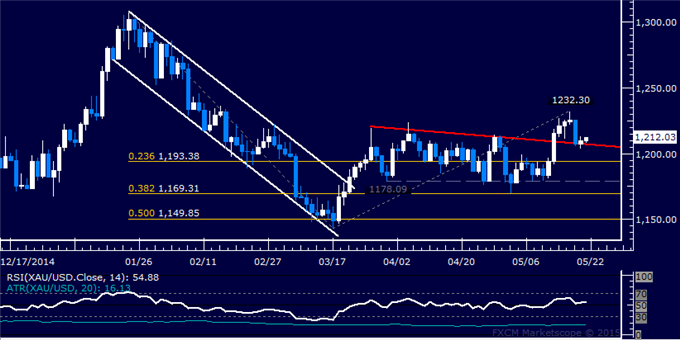
GOLD TECHNICAL ANALYSIS – Prices are consolidating after issuing the largest daily decline in three weeks. A close below trend line resistance-turned-support at 1206.69 exposes the 23.6% Fibonacci expansion at 1193.38. Near-term resistance is at 1232.30, the May 18 high.
Daily Chart - Created Using FXCM Marketscope
CRUDE OIL TECHNICAL ANALYSIS – Prices are digesting losses after issuing the largest decline in six weeks. From here, a daily close below the 23.6% Fibonacci retracement exposes the 38.2% level at 60.27. Alternatively, a move above the 14.6% retracement at 66.03 targets the 14.6% Fib expansion at 67.78.

Daily Chart - Created Using FXCM Marketscope
--- Written by Ilya Spivak, Currency Strategist for DailyFX.com
To receive Ilya's analysis directly via email, please SIGN UP HERE
Contact and follow Ilya on Twitter: @IlyaSpivak
DailyFX provides forex news and technical analysis on the trends that influence the global currency markets.
Learn forex trading with a free practice account and trading charts from FXCM.
