
 Yahoo Finance
 Gold Price Futures (GC) Technical Analysis – Strengthens into Close Over $1474.10, Weakens into Close Under $1470.00
Gold prices are trading lower late Thursday after giving back impressive gains earlier in the session after President Donald Trump said Washington was close to a trade deal with China, denting the safe-haven metal’s appeal.
Actually, gold isn’t a safe-haven asset, it’s a non-interest bearing, non-dividend paying asset. This means when Treasury yields go up, demand for gold goes down because it doesn’t pay you anything to hold on to it.
Yields rose sharply on Thursday after Trump’s announcement and gold plunged from its one-month high.
At 19:27 GMT, February Comex gold is trading $1472.60, down $2.40 or -0.16%.
Daily Technical Analysis
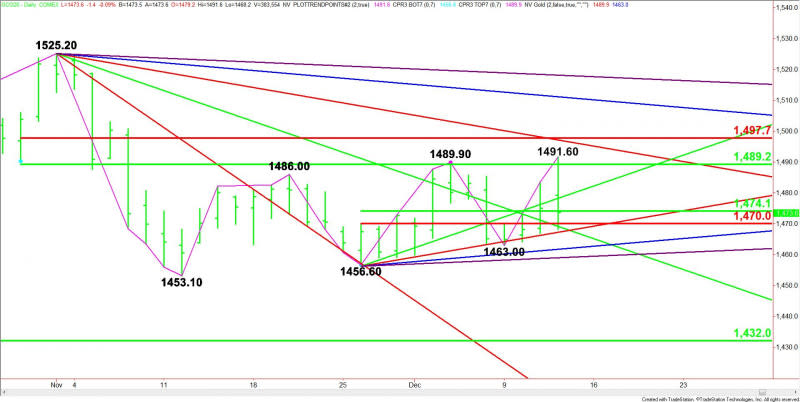
The main trend is up according to the daily swing chart. It was reaffirmed early in the session when buyers took out the previous main top at $1489.90. A trade through $1463.00 will change the main trend to down.
Today’s price action has put the gold market in a position to form a potentially bearish closing price reversal top.
The main range is $1525.20 to $1453.10. Its retracement zone at $1489.20 to $1497.70 is resistance. It stopped the selling at $1491.60 earlier in the session.
The minor range is $1456.60 to $1491.60. Its retracement zone at $1474.10 to $1470.00 is support. The market is currently trading inside this area.
Short-Term Outlook
Based on today’s price action and the current price at $1472.60, the direction of the market into the close is likely to be determined by trader reaction to $1474.10 to $1470.00.
Rising back about $1474.10 will indicate that buyers are coming in on this dip. Overcoming an uptrending Gann angle at $1478.60 will indicate the buying is getting stronger.
A break below $1470.00 will indicate the selling is getting stronger. Taking out the uptrending Gann angle at $1467.60 could trigger an acceleration to the downside with the next targets at $1463.00 and $1456.60.
This article was originally posted on FX Empire
More From FXEMPIRE:
Gold Price Prediction – Prices Consolidate Despite Falling Dollar
AUD/USD Price Forecast – Australian Dollar Continues To Reach Towards 200 Day EMA
GBP/JPY Price Forecast – British Pound Continues To Kill Time Ahead Of The Election
GBP/USD Price Forecast – British Pound Continues To Kill Time Ahead Of Election Results
