
 Yahoo Finance
 Gold Stalls at Chart Support, SPX 500 Revisits Monthly Lows
DailyFX.com -
Talking Points:
US Dollar Extends Recovery for Fourth Consecutive Day
S&P 500 Moves to Challenge Monthly Lows Once Again
Crude Oil Extends Decline, Gold Stalls at Chart Support
Can’t access the Dow Jones FXCM US Dollar Index? Try the USD basket on Mirror Trader. **
US DOLLAR TECHNICAL ANALYSIS – Prices continue to recover after finding support at the March swing low, rising for a fourth consecutive day. Near-term resistance is at 12066, the 14.6% Fibonacci expansion, with a break above that on a daily closing basis exposing the 12149-77 zone (23.6% level, March 13 high). Alternatively, a move belowthe 11858-86 area (23.6% Fib retracement, March 18 low)clears the way for a test of the 38.2% threshold at 11679.

Daily Chart - Created Using FXCM Marketscope
** The Dow Jones FXCM US Dollar Index and the Mirror Trader USD basket are not the same product.
S&P 500 TECHNICAL ANALYSIS – Prices moved lower as expected after putting in a bearish Evening Star candlestick pattern. A daily close below the March 12low at 2040.10 exposes the 38.2% Fibonacci retracement at 2004.60. Alternatively, a reversal above the 14.6% Fib expansion at 2084.00 targets the 2111.00-19.40 area (23.6% threshold, February 25 high).

Daily Chart - Created Using FXCM Marketscope
GOLD TECHNICAL ANALYSIS – Prices moved lower as expected after putting in a bearish Dark Cloud Cover candlestick pattern. A daily close below the 23.6% Fibonacci expansion at 1180.90 exposes the 38.2% level at 1156.83. Alternatively, a reversal above the 14.6% expansion at 1195.74 targets the 38.2% Fib retracement at 1205.58.

Daily Chart - Created Using FXCM Marketscope
CRUDE OIL TECHNICAL ANALYSIS – Prices reversed sharply lower after finding resistance below the $60/barrel figure. A break below the 50% Fibonacci expansion at 54.53 exposes the 61.8% level at 53.30. Alternatively, a reversal above the 38.2% Fib at 55.77 targets the March 26 high at 59.75.
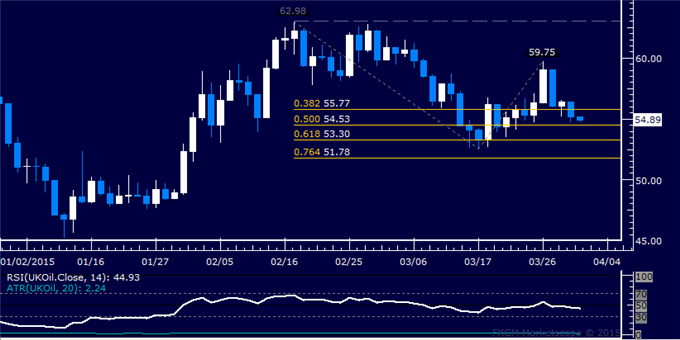
Daily Chart - Created Using FXCM Marketscope
--- Written by Ilya Spivak, Currency Strategist for DailyFX.com
To receive Ilya's analysis directly via email, please SIGN UP HERE
Contact and follow Ilya on Twitter: @IlyaSpivak
DailyFX provides forex news and technical analysis on the trends that influence the global currency markets.
Learn forex trading with a free practice account and trading charts from FXCM.
