
 Yahoo Finance
 If You Had Bought Cubic (NYSE:CUB) Shares Five Years Ago You'd Have Earned 30% Returns

The main point of investing for the long term is to make money. Furthermore, you'd generally like to see the share price rise faster than the market Unfortunately for shareholders, while the Cubic Corporation (NYSE:CUB) share price is up 30% in the last five years, that's less than the market return. Unfortunately the share price is down 16% in the last year.
See our latest analysis for Cubic
Because Cubic made a loss in the last twelve months, we think the market is probably more focussed on revenue and revenue growth, at least for now. When a company doesn't make profits, we'd generally expect to see good revenue growth. As you can imagine, fast revenue growth, when maintained, often leads to fast profit growth.
In the last 5 years Cubic saw its revenue grow at 1.0% per year. Put simply, that growth rate fails to impress. Like its revenue, its share price gained over the period. The increase of 5% per year probably reflects the modest revenue growth. It seems likely that we'll have to zoom in on the data, including profits, to understand if there is an opportunity here.
You can see how earnings and revenue have changed over time in the image below (click on the chart to see the exact values).
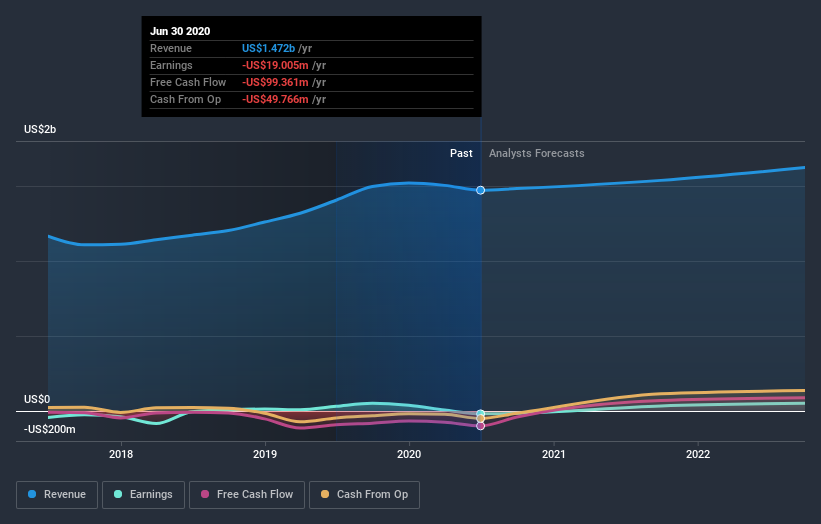
We like that insiders have been buying shares in the last twelve months. Having said that, most people consider earnings and revenue growth trends to be a more meaningful guide to the business. So we recommend checking out this free report showing consensus forecasts
What About Dividends?
As well as measuring the share price return, investors should also consider the total shareholder return (TSR). Whereas the share price return only reflects the change in the share price, the TSR includes the value of dividends (assuming they were reinvested) and the benefit of any discounted capital raising or spin-off. Arguably, the TSR gives a more comprehensive picture of the return generated by a stock. We note that for Cubic the TSR over the last 5 years was 33%, which is better than the share price return mentioned above. And there's no prize for guessing that the dividend payments largely explain the divergence!
A Different Perspective
While the broader market gained around 23% in the last year, Cubic shareholders lost 16% (even including dividends). Even the share prices of good stocks drop sometimes, but we want to see improvements in the fundamental metrics of a business, before getting too interested. On the bright side, long term shareholders have made money, with a gain of 6% per year over half a decade. If the fundamental data continues to indicate long term sustainable growth, the current sell-off could be an opportunity worth considering. I find it very interesting to look at share price over the long term as a proxy for business performance. But to truly gain insight, we need to consider other information, too. Like risks, for instance. Every company has them, and we've spotted 2 warning signs for Cubic (of which 1 is a bit concerning!) you should know about.
There are plenty of other companies that have insiders buying up shares. You probably do not want to miss this free list of growing companies that insiders are buying.
Please note, the market returns quoted in this article reflect the market weighted average returns of stocks that currently trade on US exchanges.
This article by Simply Wall St is general in nature. It does not constitute a recommendation to buy or sell any stock, and does not take account of your objectives, or your financial situation. We aim to bring you long-term focused analysis driven by fundamental data. Note that our analysis may not factor in the latest price-sensitive company announcements or qualitative material. Simply Wall St has no position in any stocks mentioned.
Have feedback on this article? Concerned about the content? Get in touch with us directly. Alternatively, email editorial-team@simplywallst.com.
