
 Yahoo Finance
 If You Had Bought Home Depot (NYSE:HD) Stock Five Years Ago, You Could Pocket A 110% Gain Today

When you buy a stock there is always a possibility that it could drop 100%. But on the bright side, you can make far more than 100% on a really good stock. Long term The Home Depot, Inc. (NYSE:HD) shareholders would be well aware of this, since the stock is up 110% in five years. Meanwhile the share price is 1.7% higher than it was a week ago.
See our latest analysis for Home Depot
While the efficient markets hypothesis continues to be taught by some, it has been proven that markets are over-reactive dynamic systems, and investors are not always rational. One way to examine how market sentiment has changed over time is to look at the interaction between a company's share price and its earnings per share (EPS).
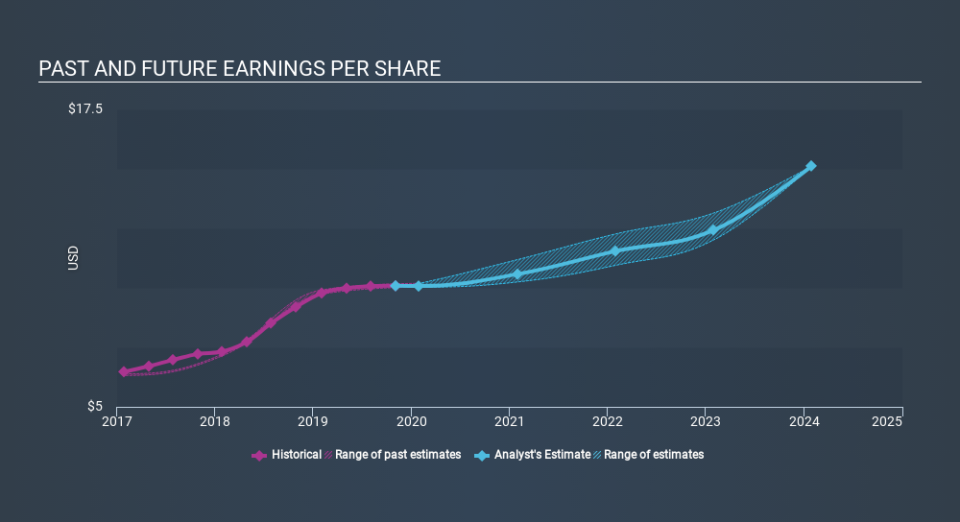
Over half a decade, Home Depot managed to grow its earnings per share at 18% a year. This EPS growth is reasonably close to the 16% average annual increase in the share price. That suggests that the market sentiment around the company hasn't changed much over that time. Indeed, it would appear the share price is reacting to the EPS.
You can see how EPS has changed over time in the image below (click on the chart to see the exact values).
This free interactive report on Home Depot's earnings, revenue and cash flow is a great place to start, if you want to investigate the stock further.
What About Dividends?
As well as measuring the share price return, investors should also consider the total shareholder return (TSR). The TSR is a return calculation that accounts for the value of cash dividends (assuming that any dividend received was reinvested) and the calculated value of any discounted capital raisings and spin-offs. So for companies that pay a generous dividend, the TSR is often a lot higher than the share price return. We note that for Home Depot the TSR over the last 5 years was 135%, which is better than the share price return mentioned above. And there's no prize for guessing that the dividend payments largely explain the divergence!
A Different Perspective
Home Depot's TSR for the year was broadly in line with the market average, at 42%. Most would be happy with a gain, and it helps that the year's return is actually better than the average return over five years, which was 19%. Even if the share price growth slows down from here, there's a good chance that this is business worth watching in the long term. Before spending more time on Home Depot it might be wise to click here to see if insiders have been buying or selling shares.
For those who like to find winning investments this free list of growing companies with recent insider purchasing, could be just the ticket.
Please note, the market returns quoted in this article reflect the market weighted average returns of stocks that currently trade on US exchanges.
If you spot an error that warrants correction, please contact the editor at editorial-team@simplywallst.com. This article by Simply Wall St is general in nature. It does not constitute a recommendation to buy or sell any stock, and does not take account of your objectives, or your financial situation. Simply Wall St has no position in the stocks mentioned.
We aim to bring you long-term focused research analysis driven by fundamental data. Note that our analysis may not factor in the latest price-sensitive company announcements or qualitative material. Thank you for reading.
