
 Yahoo Finance
 If You Had Bought Rentokil Initial (LON:RTO) Stock Five Years Ago, You Could Pocket A 254% Gain Today

Want to participate in a short research study? Help shape the future of investing tools and you could win a $250 gift card!
The worst result, after buying shares in a company (assuming no leverage), would be if you lose all the money you put in. But on a lighter note, a good company can see its share price rise well over 100%. For instance, the price of Rentokil Initial plc (LON:RTO) stock is up an impressive 254% over the last five years. On top of that, the share price is up 13% in about a quarter.
Check out our latest analysis for Rentokil Initial
There is no denying that markets are sometimes efficient, but prices do not always reflect underlying business performance. By comparing earnings per share (EPS) and share price changes over time, we can get a feel for how investor attitudes to a company have morphed over time.
During five years of share price growth, Rentokil Initial achieved compound earnings per share (EPS) growth of 23% per year. We note, however, that extraordinary items have impacted earnings. This EPS growth is slower than the share price growth of 29% per year, over the same period. This suggests that market participants hold the company in higher regard, these days. That's not necessarily surprising considering the five-year track record of earnings growth.
The graphic below depicts how EPS has changed over time (unveil the exact values by clicking on the image).
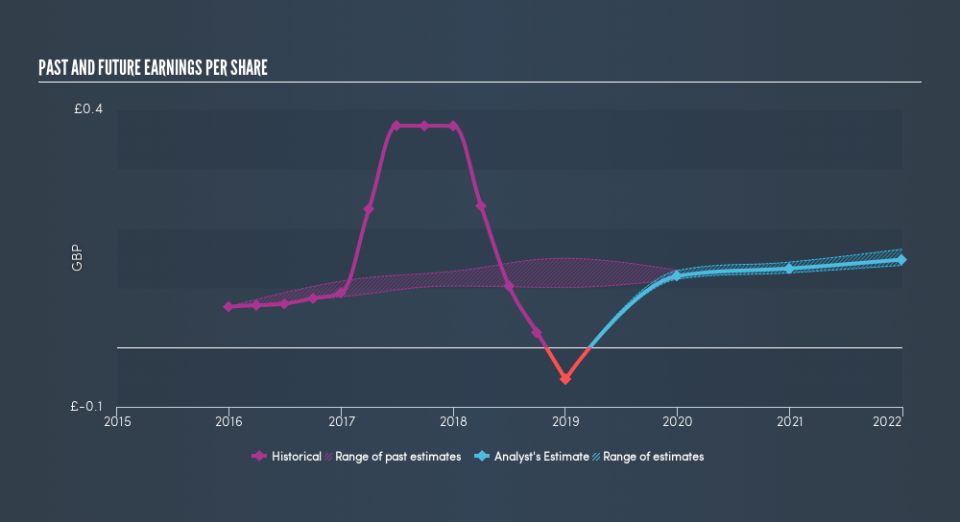
Dive deeper into Rentokil Initial's key metrics by checking this interactive graph of Rentokil Initial's earnings, revenue and cash flow.
What About Dividends?
It is important to consider the total shareholder return, as well as the share price return, for any given stock. The TSR incorporates the value of any spin-offs or discounted capital raisings, along with any dividends, based on the assumption that the dividends are reinvested. So for companies that pay a generous dividend, the TSR is often a lot higher than the share price return. As it happens, Rentokil Initial's TSR for the last 5 years was 282%, which exceeds the share price return mentioned earlier. The dividends paid by the company have thusly boosted the total shareholder return.
A Different Perspective
It's good to see that Rentokil Initial has rewarded shareholders with a total shareholder return of 19% in the last twelve months. Of course, that includes the dividend. Having said that, the five-year TSR of 31% a year, is even better. The pessimistic view would be that be that the stock has its best days behind it, but on the other hand the price might simply be moderating while the business itself continues to execute. You could get a better understanding of Rentokil Initial's growth by checking out this more detailed historical graph of earnings, revenue and cash flow.
If you are like me, then you will not want to miss this free list of growing companies that insiders are buying.
Please note, the market returns quoted in this article reflect the market weighted average returns of stocks that currently trade on GB exchanges.
We aim to bring you long-term focused research analysis driven by fundamental data. Note that our analysis may not factor in the latest price-sensitive company announcements or qualitative material.
If you spot an error that warrants correction, please contact the editor at editorial-team@simplywallst.com. This article by Simply Wall St is general in nature. It does not constitute a recommendation to buy or sell any stock, and does not take account of your objectives, or your financial situation. Simply Wall St has no position in the stocks mentioned. Thank you for reading.
