
 Yahoo Finance
 If You Had Bought Vector (NZSE:VCT) Stock Five Years Ago, You Could Pocket A 29% Gain Today

When you buy and hold a stock for the long term, you definitely want it to provide a positive return. Better yet, you'd like to see the share price move up more than the market average. But Vector Limited (NZSE:VCT) has fallen short of that second goal, with a share price rise of 29% over five years, which is below the market return. Looking at the last year alone, the stock is up 5.7%.
View our latest analysis for Vector
While markets are a powerful pricing mechanism, share prices reflect investor sentiment, not just underlying business performance. One flawed but reasonable way to assess how sentiment around a company has changed is to compare the earnings per share (EPS) with the share price.
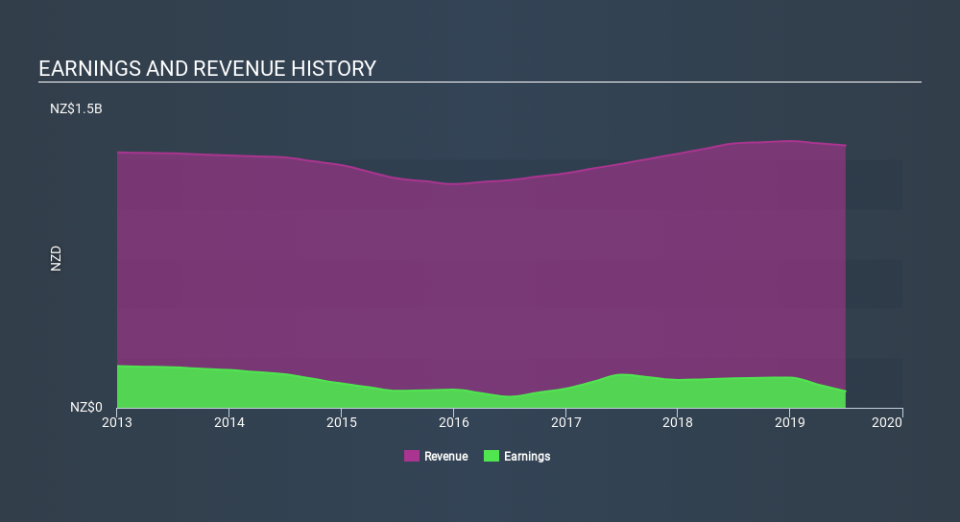
Vector's earnings per share are down 13% per year, despite strong share price performance over five years.
Essentially, it doesn't seem likely that investors are focused on EPS. Because earnings per share don't seem to match up with the share price, we'll take a look at other metrics instead.
In fact, the dividend has increased over time, which is a positive. Maybe dividend investors have helped support the share price.
The graphic below depicts how earnings and revenue have changed over time (unveil the exact values by clicking on the image).
You can see how its balance sheet has strengthened (or weakened) over time in this free interactive graphic.
What About Dividends?
When looking at investment returns, it is important to consider the difference between total shareholder return (TSR) and share price return. Whereas the share price return only reflects the change in the share price, the TSR includes the value of dividends (assuming they were reinvested) and the benefit of any discounted capital raising or spin-off. Arguably, the TSR gives a more comprehensive picture of the return generated by a stock. In the case of Vector, it has a TSR of 71% for the last 5 years. That exceeds its share price return that we previously mentioned. This is largely a result of its dividend payments!
A Different Perspective
Vector shareholders gained a total return of 12% during the year. But that was short of the market average. The silver lining is that the gain was actually better than the average annual return of 11% per year over five year. This could indicate that the company is winning over new investors, as it pursues its strategy. Importantly, we haven't analysed Vector's dividend history. This free visual report on its dividends is a must-read if you're thinking of buying.
For those who like to find winning investments this free list of growing companies with recent insider purchasing, could be just the ticket.
Please note, the market returns quoted in this article reflect the market weighted average returns of stocks that currently trade on NZ exchanges.
If you spot an error that warrants correction, please contact the editor at editorial-team@simplywallst.com. This article by Simply Wall St is general in nature. It does not constitute a recommendation to buy or sell any stock, and does not take account of your objectives, or your financial situation. Simply Wall St has no position in the stocks mentioned.
We aim to bring you long-term focused research analysis driven by fundamental data. Note that our analysis may not factor in the latest price-sensitive company announcements or qualitative material. Thank you for reading.
