
 Yahoo Finance
 Here's How P/E Ratios Can Help Us Understand Cleveland-Cliffs Inc. (NYSE:CLF)

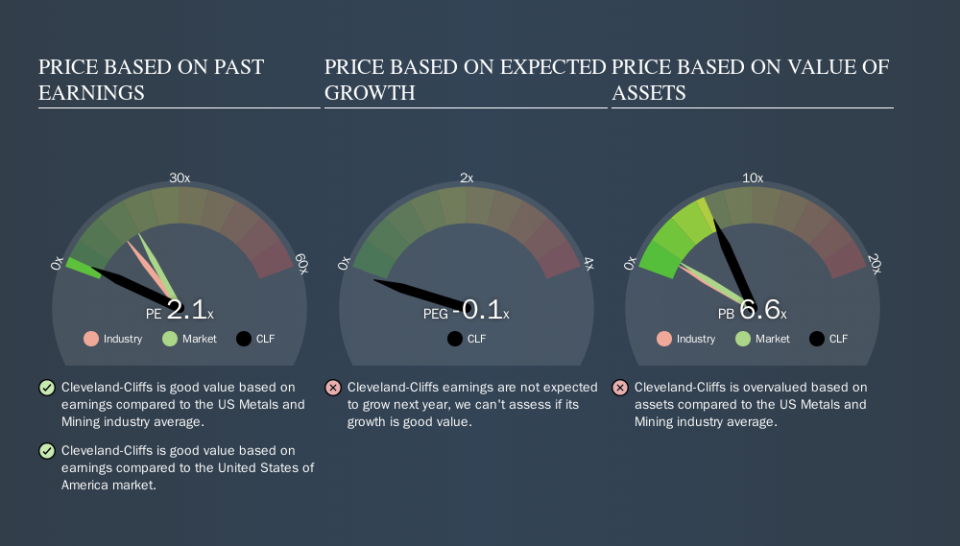
The goal of this article is to teach you how to use price to earnings ratios (P/E ratios). We'll apply a basic P/E ratio analysis to Cleveland-Cliffs Inc.'s (NYSE:CLF), to help you decide if the stock is worth further research. Cleveland-Cliffs has a P/E ratio of 2.11, based on the last twelve months. That is equivalent to an earnings yield of about 47.4%.
Check out our latest analysis for Cleveland-Cliffs
How Do I Calculate A Price To Earnings Ratio?
The formula for price to earnings is:
Price to Earnings Ratio = Share Price ÷ Earnings per Share (EPS)
Or for Cleveland-Cliffs:
P/E of 2.11 = $7.01 ÷ $3.32 (Based on the year to June 2019.)
Is A High Price-to-Earnings Ratio Good?
A higher P/E ratio means that investors are paying a higher price for each $1 of company earnings. All else being equal, it's better to pay a low price -- but as Warren Buffett said, 'It's far better to buy a wonderful company at a fair price than a fair company at a wonderful price.
Does Cleveland-Cliffs Have A Relatively High Or Low P/E For Its Industry?
The P/E ratio indicates whether the market has higher or lower expectations of a company. If you look at the image below, you can see Cleveland-Cliffs has a lower P/E than the average (13.4) in the metals and mining industry classification.
This suggests that market participants think Cleveland-Cliffs will underperform other companies in its industry. Many investors like to buy stocks when the market is pessimistic about their prospects. You should delve deeper. I like to check if company insiders have been buying or selling.
How Growth Rates Impact P/E Ratios
Probably the most important factor in determining what P/E a company trades on is the earnings growth. That's because companies that grow earnings per share quickly will rapidly increase the 'E' in the equation. And in that case, the P/E ratio itself will drop rather quickly. So while a stock may look expensive based on past earnings, it could be cheap based on future earnings.
In the last year, Cleveland-Cliffs grew EPS like Taylor Swift grew her fan base back in 2010; the 73% gain was both fast and well deserved. Even better, EPS is up 71% per year over three years. So you might say it really deserves to have an above-average P/E ratio.
Don't Forget: The P/E Does Not Account For Debt or Bank Deposits
Don't forget that the P/E ratio considers market capitalization. That means it doesn't take debt or cash into account. Hypothetically, a company could reduce its future P/E ratio by spending its cash (or taking on debt) to achieve higher earnings.
Such spending might be good or bad, overall, but the key point here is that you need to look at debt to understand the P/E ratio in context.
Cleveland-Cliffs's Balance Sheet
Cleveland-Cliffs has net debt worth 90% of its market capitalization. If you want to compare its P/E ratio to other companies, you should absolutely keep in mind it has significant borrowings.
The Verdict On Cleveland-Cliffs's P/E Ratio
Cleveland-Cliffs has a P/E of 2.1. That's below the average in the US market, which is 17.7. The company has a meaningful amount of debt on the balance sheet, but that should not eclipse the solid earnings growth. The low P/E ratio suggests current market expectations are muted, implying these levels of growth will not continue.
Investors should be looking to buy stocks that the market is wrong about. As value investor Benjamin Graham famously said, 'In the short run, the market is a voting machine but in the long run, it is a weighing machine. So this free report on the analyst consensus forecasts could help you make a master move on this stock.
But note: Cleveland-Cliffs may not be the best stock to buy. So take a peek at this free list of interesting companies with strong recent earnings growth (and a P/E ratio below 20).
We aim to bring you long-term focused research analysis driven by fundamental data. Note that our analysis may not factor in the latest price-sensitive company announcements or qualitative material.
If you spot an error that warrants correction, please contact the editor at editorial-team@simplywallst.com. This article by Simply Wall St is general in nature. It does not constitute a recommendation to buy or sell any stock, and does not take account of your objectives, or your financial situation. Simply Wall St has no position in the stocks mentioned. Thank you for reading.
