
 Yahoo Finance
 Here's What Spark New Zealand Limited's (NZSE:SPK) ROCE Can Tell Us

Want to participate in a short research study? Help shape the future of investing tools and you could win a $250 gift card!
Today we'll evaluate Spark New Zealand Limited (NZSE:SPK) to determine whether it could have potential as an investment idea. In particular, we'll consider its Return On Capital Employed (ROCE), as that can give us insight into how profitably the company is able to employ capital in its business.
First, we'll go over how we calculate ROCE. Next, we'll compare it to others in its industry. Last but not least, we'll look at what impact its current liabilities have on its ROCE.
What is Return On Capital Employed (ROCE)?
ROCE is a measure of a company's yearly pre-tax profit (its return), relative to the capital employed in the business. In general, businesses with a higher ROCE are usually better quality. In brief, it is a useful tool, but it is not without drawbacks. Author Edwin Whiting says to be careful when comparing the ROCE of different businesses, since 'No two businesses are exactly alike.'
So, How Do We Calculate ROCE?
The formula for calculating the return on capital employed is:
Return on Capital Employed = Earnings Before Interest and Tax (EBIT) ÷ (Total Assets - Current Liabilities)
Or for Spark New Zealand:
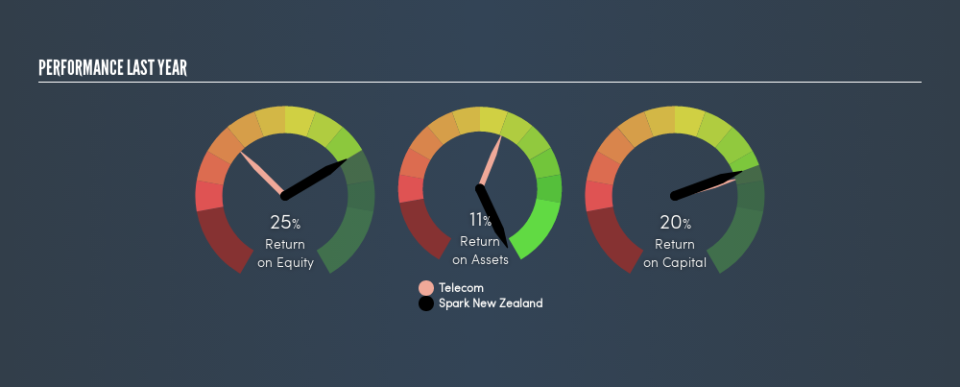
0.20 = NZ$629m ÷ (NZ$4.1b - NZ$980m) (Based on the trailing twelve months to December 2018.)
So, Spark New Zealand has an ROCE of 20%.
View our latest analysis for Spark New Zealand
Is Spark New Zealand's ROCE Good?
ROCE can be useful when making comparisons, such as between similar companies. In our analysis, Spark New Zealand's ROCE is meaningfully higher than the 8.2% average in the Telecom industry. We consider this a positive sign, because it suggests it uses capital more efficiently than similar companies. Putting aside its position relative to its industry for now, in absolute terms, Spark New Zealand's ROCE is currently very good.
The image below shows how Spark New Zealand's ROCE compares to its industry, and you can click it to see more detail on its past growth.
Remember that this metric is backwards looking - it shows what has happened in the past, and does not accurately predict the future. Companies in cyclical industries can be difficult to understand using ROCE, as returns typically look high during boom times, and low during busts. ROCE is, after all, simply a snap shot of a single year. Since the future is so important for investors, you should check out our free report on analyst forecasts for Spark New Zealand.
Do Spark New Zealand's Current Liabilities Skew Its ROCE?
Liabilities, such as supplier bills and bank overdrafts, are referred to as current liabilities if they need to be paid within 12 months. Due to the way ROCE is calculated, a high level of current liabilities makes a company look as though it has less capital employed, and thus can (sometimes unfairly) boost the ROCE. To counteract this, we check if a company has high current liabilities, relative to its total assets.
Spark New Zealand has total liabilities of NZ$980m and total assets of NZ$4.1b. Therefore its current liabilities are equivalent to approximately 24% of its total assets. This is quite a low level of current liabilities which would not greatly boost the already high ROCE.
The Bottom Line On Spark New Zealand's ROCE
Low current liabilities and high ROCE is a good combination, making Spark New Zealand look quite interesting. There might be better investments than Spark New Zealand out there, but you will have to work hard to find them . These promising businesses with rapidly growing earnings might be right up your alley.
I will like Spark New Zealand better if I see some big insider buys. While we wait, check out this free list of growing companies with considerable, recent, insider buying.
We aim to bring you long-term focused research analysis driven by fundamental data. Note that our analysis may not factor in the latest price-sensitive company announcements or qualitative material.
If you spot an error that warrants correction, please contact the editor at editorial-team@simplywallst.com. This article by Simply Wall St is general in nature. It does not constitute a recommendation to buy or sell any stock, and does not take account of your objectives, or your financial situation. Simply Wall St has no position in the stocks mentioned. Thank you for reading.
