
 Yahoo Finance
 Here's What To Make Of Vector's (NZSE:VCT) Decelerating Rates Of Return
If you're not sure where to start when looking for the next multi-bagger, there are a few key trends you should keep an eye out for. Ideally, a business will show two trends; firstly a growing return on capital employed (ROCE) and secondly, an increasing amount of capital employed. Basically this means that a company has profitable initiatives that it can continue to reinvest in, which is a trait of a compounding machine. However, after briefly looking over the numbers, we don't think Vector (NZSE:VCT) has the makings of a multi-bagger going forward, but let's have a look at why that may be.
Return On Capital Employed (ROCE): What is it?
Just to clarify if you're unsure, ROCE is a metric for evaluating how much pre-tax income (in percentage terms) a company earns on the capital invested in its business. Analysts use this formula to calculate it for Vector:
Return on Capital Employed = Earnings Before Interest and Tax (EBIT) ÷ (Total Assets - Current Liabilities)
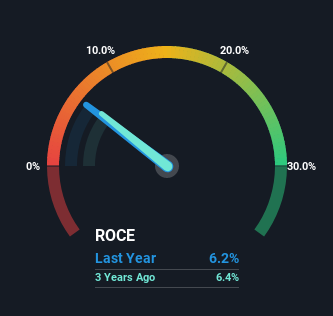
0.062 = NZ$367m ÷ (NZ$6.6b - NZ$682m) (Based on the trailing twelve months to December 2021).
So, Vector has an ROCE of 6.2%. On its own that's a low return, but compared to the average of 5.0% generated by the Integrated Utilities industry, it's much better.
Check out our latest analysis for Vector
Above you can see how the current ROCE for Vector compares to its prior returns on capital, but there's only so much you can tell from the past. If you'd like, you can check out the forecasts from the analysts covering Vector here for free.
What Does the ROCE Trend For Vector Tell Us?
There are better returns on capital out there than what we're seeing at Vector. The company has consistently earned 6.2% for the last five years, and the capital employed within the business has risen 27% in that time. This poor ROCE doesn't inspire confidence right now, and with the increase in capital employed, it's evident that the business isn't deploying the funds into high return investments.
Our Take On Vector's ROCE
In summary, Vector has simply been reinvesting capital and generating the same low rate of return as before. Although the market must be expecting these trends to improve because the stock has gained 73% over the last five years. Ultimately, if the underlying trends persist, we wouldn't hold our breath on it being a multi-bagger going forward.
Vector does come with some risks though, we found 3 warning signs in our investment analysis, and 2 of those make us uncomfortable...
While Vector may not currently earn the highest returns, we've compiled a list of companies that currently earn more than 25% return on equity. Check out this free list here.
Have feedback on this article? Concerned about the content? Get in touch with us directly. Alternatively, email editorial-team (at) simplywallst.com.
This article by Simply Wall St is general in nature. We provide commentary based on historical data and analyst forecasts only using an unbiased methodology and our articles are not intended to be financial advice. It does not constitute a recommendation to buy or sell any stock, and does not take account of your objectives, or your financial situation. We aim to bring you long-term focused analysis driven by fundamental data. Note that our analysis may not factor in the latest price-sensitive company announcements or qualitative material. Simply Wall St has no position in any stocks mentioned.
