
 Yahoo Finance
 Hibbett (NASDAQ:HIBB) sheds 7.6% this week, as yearly returns fall more in line with earnings growth
Hibbett, Inc. (NASDAQ:HIBB) shareholders have seen the share price descend 18% over the month. But over three years the performance has been really wonderful. Over that time, we've been excited to watch the share price climb an impressive 434%. So you might argue that the recent reduction in the share price is unremarkable in light of the longer term performance. The thing to consider is whether there is still too much elation around the company's prospects.
In light of the stock dropping 7.6% in the past week, we want to investigate the longer term story, and see if fundamentals have been the driver of the company's positive three-year return.
View our latest analysis for Hibbett
To quote Buffett, 'Ships will sail around the world but the Flat Earth Society will flourish. There will continue to be wide discrepancies between price and value in the marketplace...' One way to examine how market sentiment has changed over time is to look at the interaction between a company's share price and its earnings per share (EPS).
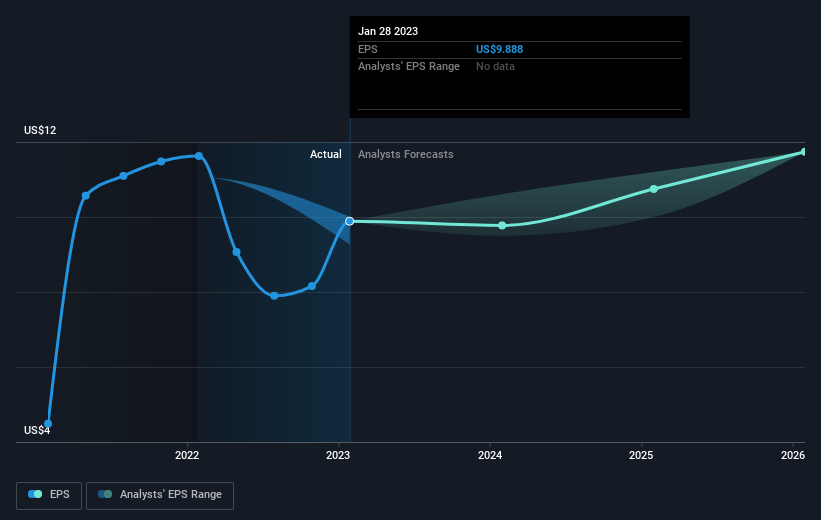
Hibbett was able to grow its EPS at 87% per year over three years, sending the share price higher. We note that the 75% yearly (average) share price gain isn't too far from the EPS growth rate. Coincidence? Probably not. This observation indicates that the market's attitude to the business hasn't changed all that much. Rather, the share price has approximately tracked EPS growth.
The graphic below depicts how EPS has changed over time (unveil the exact values by clicking on the image).
We know that Hibbett has improved its bottom line over the last three years, but what does the future have in store? This free interactive report on Hibbett's balance sheet strength is a great place to start, if you want to investigate the stock further.
What About Dividends?
It is important to consider the total shareholder return, as well as the share price return, for any given stock. Whereas the share price return only reflects the change in the share price, the TSR includes the value of dividends (assuming they were reinvested) and the benefit of any discounted capital raising or spin-off. Arguably, the TSR gives a more comprehensive picture of the return generated by a stock. We note that for Hibbett the TSR over the last 3 years was 451%, which is better than the share price return mentioned above. And there's no prize for guessing that the dividend payments largely explain the divergence!
A Different Perspective
It's good to see that Hibbett has rewarded shareholders with a total shareholder return of 32% in the last twelve months. And that does include the dividend. That's better than the annualised return of 20% over half a decade, implying that the company is doing better recently. In the best case scenario, this may hint at some real business momentum, implying that now could be a great time to delve deeper. It's always interesting to track share price performance over the longer term. But to understand Hibbett better, we need to consider many other factors. Even so, be aware that Hibbett is showing 1 warning sign in our investment analysis , you should know about...
But note: Hibbett may not be the best stock to buy. So take a peek at this free list of interesting companies with past earnings growth (and further growth forecast).
Please note, the market returns quoted in this article reflect the market weighted average returns of stocks that currently trade on American exchanges.
Have feedback on this article? Concerned about the content? Get in touch with us directly. Alternatively, email editorial-team (at) simplywallst.com.
This article by Simply Wall St is general in nature. We provide commentary based on historical data and analyst forecasts only using an unbiased methodology and our articles are not intended to be financial advice. It does not constitute a recommendation to buy or sell any stock, and does not take account of your objectives, or your financial situation. We aim to bring you long-term focused analysis driven by fundamental data. Note that our analysis may not factor in the latest price-sensitive company announcements or qualitative material. Simply Wall St has no position in any stocks mentioned.
Join A Paid User Research Session
You’ll receive a US$30 Amazon Gift card for 1 hour of your time while helping us build better investing tools for the individual investors like yourself. Sign up here
