
 Yahoo Finance
 Improved Earnings Required Before Eupe Corporation Berhad (KLSE:EUPE) Shares Find Their Feet
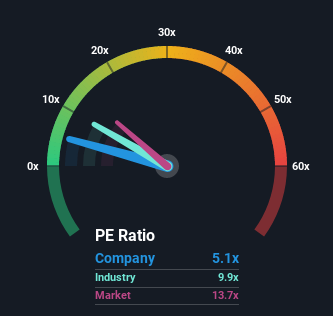
With a price-to-earnings (or "P/E") ratio of 5.1x Eupe Corporation Berhad (KLSE:EUPE) may be sending very bullish signals at the moment, given that almost half of all companies in Malaysia have P/E ratios greater than 14x and even P/E's higher than 26x are not unusual. However, the P/E might be quite low for a reason and it requires further investigation to determine if it's justified.
For instance, Eupe Corporation Berhad's receding earnings in recent times would have to be some food for thought. It might be that many expect the disappointing earnings performance to continue or accelerate, which has repressed the P/E. If you like the company, you'd be hoping this isn't the case so that you could potentially pick up some stock while it's out of favour.
View our latest analysis for Eupe Corporation Berhad
Want the full picture on earnings, revenue and cash flow for the company? Then our free report on Eupe Corporation Berhad will help you shine a light on its historical performance.
Is There Any Growth For Eupe Corporation Berhad?
The only time you'd be truly comfortable seeing a P/E as depressed as Eupe Corporation Berhad's is when the company's growth is on track to lag the market decidedly.
Taking a look back first, the company's earnings per share growth last year wasn't something to get excited about as it posted a disappointing decline of 20%. This means it has also seen a slide in earnings over the longer-term as EPS is down 42% in total over the last three years. So unfortunately, we have to acknowledge that the company has not done a great job of growing earnings over that time.
Comparing that to the market, which is predicted to deliver 8.7% growth in the next 12 months, the company's downward momentum based on recent medium-term earnings results is a sobering picture.
In light of this, it's understandable that Eupe Corporation Berhad's P/E would sit below the majority of other companies. Nonetheless, there's no guarantee the P/E has reached a floor yet with earnings going in reverse. There's potential for the P/E to fall to even lower levels if the company doesn't improve its profitability.
The Bottom Line On Eupe Corporation Berhad's P/E
Generally, our preference is to limit the use of the price-to-earnings ratio to establishing what the market thinks about the overall health of a company.
As we suspected, our examination of Eupe Corporation Berhad revealed its shrinking earnings over the medium-term are contributing to its low P/E, given the market is set to grow. Right now shareholders are accepting the low P/E as they concede future earnings probably won't provide any pleasant surprises. If recent medium-term earnings trends continue, it's hard to see the share price moving strongly in either direction in the near future under these circumstances.
Don't forget that there may be other risks. For instance, we've identified 2 warning signs for Eupe Corporation Berhad that you should be aware of.
If P/E ratios interest you, you may wish to see this free collection of other companies that have grown earnings strongly and trade on P/E's below 20x.
Have feedback on this article? Concerned about the content? Get in touch with us directly. Alternatively, email editorial-team (at) simplywallst.com.
This article by Simply Wall St is general in nature. We provide commentary based on historical data and analyst forecasts only using an unbiased methodology and our articles are not intended to be financial advice. It does not constitute a recommendation to buy or sell any stock, and does not take account of your objectives, or your financial situation. We aim to bring you long-term focused analysis driven by fundamental data. Note that our analysis may not factor in the latest price-sensitive company announcements or qualitative material. Simply Wall St has no position in any stocks mentioned.
Join A Paid User Research Session
You’ll receive a US$30 Amazon Gift card for 1 hour of your time while helping us build better investing tools for the individual investors like yourself. Sign up here
