
 Yahoo Finance
 Infineon Technologies (ETR:IFX) shareholders have earned a 24% CAGR over the last three years
One simple way to benefit from the stock market is to buy an index fund. But many of us dare to dream of bigger returns, and build a portfolio ourselves. For example, the Infineon Technologies AG (ETR:IFX) share price is up 86% in the last three years, clearly besting the market return of around 12% (not including dividends). On the other hand, the returns haven't been quite so good recently, with shareholders up just 21% , including dividends .
So let's investigate and see if the longer term performance of the company has been in line with the underlying business' progress.
View our latest analysis for Infineon Technologies
While markets are a powerful pricing mechanism, share prices reflect investor sentiment, not just underlying business performance. One flawed but reasonable way to assess how sentiment around a company has changed is to compare the earnings per share (EPS) with the share price.
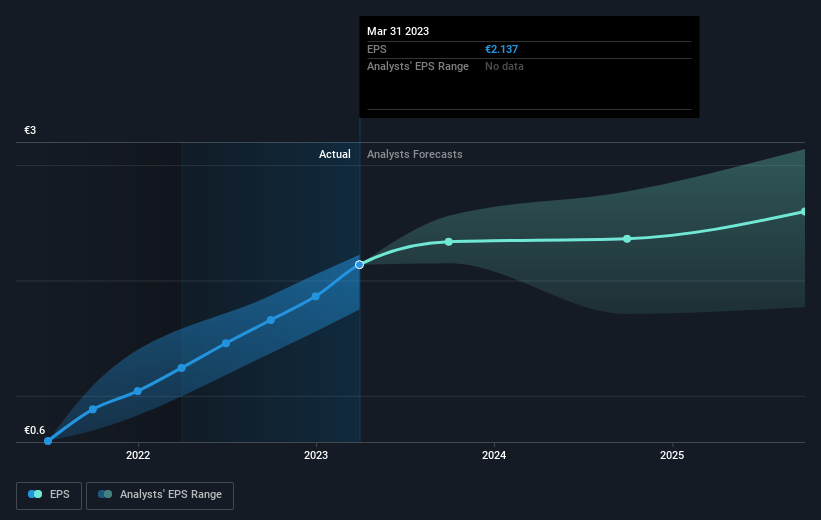
Infineon Technologies was able to grow its EPS at 51% per year over three years, sending the share price higher. This EPS growth is higher than the 23% average annual increase in the share price. Therefore, it seems the market has moderated its expectations for growth, somewhat.
The company's earnings per share (over time) is depicted in the image below (click to see the exact numbers).
We know that Infineon Technologies has improved its bottom line over the last three years, but what does the future have in store? This free interactive report on Infineon Technologies' balance sheet strength is a great place to start, if you want to investigate the stock further.
What About Dividends?
It is important to consider the total shareholder return, as well as the share price return, for any given stock. The TSR incorporates the value of any spin-offs or discounted capital raisings, along with any dividends, based on the assumption that the dividends are reinvested. Arguably, the TSR gives a more comprehensive picture of the return generated by a stock. We note that for Infineon Technologies the TSR over the last 3 years was 91%, which is better than the share price return mentioned above. The dividends paid by the company have thusly boosted the total shareholder return.
A Different Perspective
We're pleased to report that Infineon Technologies shareholders have received a total shareholder return of 21% over one year. That's including the dividend. That's better than the annualised return of 8% over half a decade, implying that the company is doing better recently. Someone with an optimistic perspective could view the recent improvement in TSR as indicating that the business itself is getting better with time. Is Infineon Technologies cheap compared to other companies? These 3 valuation measures might help you decide.
Of course, you might find a fantastic investment by looking elsewhere. So take a peek at this free list of companies we expect will grow earnings.
Please note, the market returns quoted in this article reflect the market weighted average returns of stocks that currently trade on German exchanges.
Have feedback on this article? Concerned about the content? Get in touch with us directly. Alternatively, email editorial-team (at) simplywallst.com.
This article by Simply Wall St is general in nature. We provide commentary based on historical data and analyst forecasts only using an unbiased methodology and our articles are not intended to be financial advice. It does not constitute a recommendation to buy or sell any stock, and does not take account of your objectives, or your financial situation. We aim to bring you long-term focused analysis driven by fundamental data. Note that our analysis may not factor in the latest price-sensitive company announcements or qualitative material. Simply Wall St has no position in any stocks mentioned.
Join A Paid User Research Session
You’ll receive a US$30 Amazon Gift card for 1 hour of your time while helping us build better investing tools for the individual investors like yourself. Sign up here
