
 Yahoo Finance
 Do Institutions Own Scales Corporation Limited (NZSE:SCL) Shares?

The big shareholder groups in Scales Corporation Limited (NZSE:SCL) have power over the company. Insiders often own a large chunk of younger, smaller, companies while huge companies tend to have institutions as shareholders. Companies that have been privatized tend to have low insider ownership.
Scales is a smaller company with a market capitalization of NZ$714m, so it may still be flying under the radar of many institutional investors. In the chart below below, we can see that institutions are noticeable on the share registry. We can zoom in on the different ownership groups, to learn more about SCL.
View our latest analysis for Scales

What Does The Institutional Ownership Tell Us About Scales?
Institutions typically measure themselves against a benchmark when reporting to their own investors, so they often become more enthusiastic about a stock once it's included in a major index. We would expect most companies to have some institutions on the register, especially if they are growing.
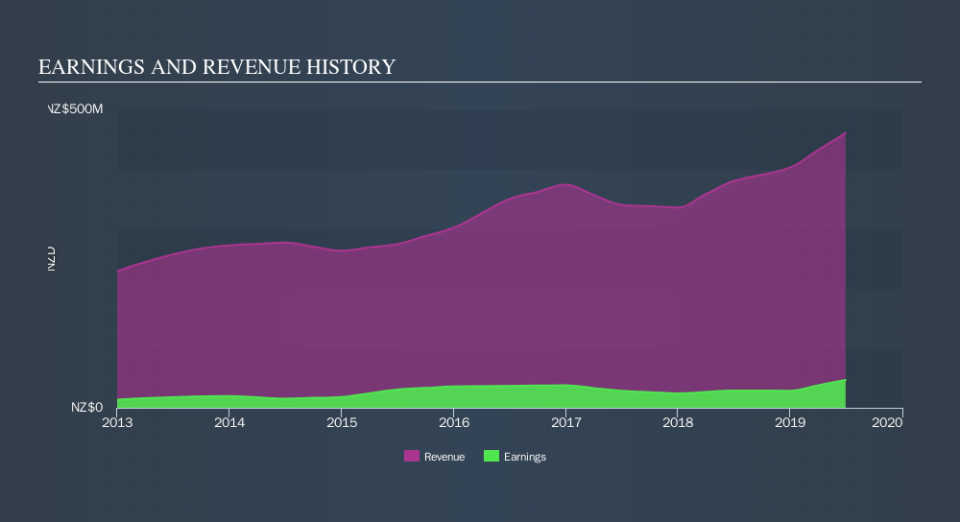
As you can see, institutional investors own 23% of Scales. This suggests some credibility amongst professional investors. But we can't rely on that fact alone, since institutions make bad investments sometimes, just like everyone does. If multiple institutions change their view on a stock at the same time, you could see the share price drop fast. It's therefore worth looking at Scales's earnings history, below. Of course, the future is what really matters.
Hedge funds don't have many shares in Scales. Quite a few analysts cover the stock, so you could look into forecast growth quite easily.
Insider Ownership Of Scales
While the precise definition of an insider can be subjective, almost everyone considers board members to be insiders. The company management answer to the board; and the latter should represent the interests of shareholders. Notably, sometimes top-level managers are on the board, themselves.
Most consider insider ownership a positive because it can indicate the board is well aligned with other shareholders. However, on some occasions too much power is concentrated within this group.
I can report that insiders do own shares in Scales Corporation Limited. As individuals, the insiders collectively own NZ$34m worth of the NZ$714m company. Some would say this shows alignment of interests between shareholders and the board. But it might be worth checking if those insiders have been selling.
General Public Ownership
The general public -- mostly retail investors -- own 56% of Scales. With this size of ownership, retail investors can collectively play a role in decisions that affect shareholder returns, such as dividend policies and the appointment of directors. They can also exercise the power to decline an acquisition or merger that may not improve profitability.
Private Company Ownership
We can see that Private Companies own 15%, of the shares on issue. It's hard to draw any conclusions from this fact alone, so its worth looking into who owns those private companies. Sometimes insiders or other related parties have an interest in shares in a public company through a separate private company.
Next Steps:
I find it very interesting to look at who exactly owns a company. But to truly gain insight, we need to consider other information, too.
I always like to check for a history of revenue growth. You can too, by accessing this free chart of historic revenue and earnings in this detailed graph.
If you are like me, you may want to think about whether this company will grow or shrink. Luckily, you can check this free report showing analyst forecasts for its future.
NB: Figures in this article are calculated using data from the last twelve months, which refer to the 12-month period ending on the last date of the month the financial statement is dated. This may not be consistent with full year annual report figures.
We aim to bring you long-term focused research analysis driven by fundamental data. Note that our analysis may not factor in the latest price-sensitive company announcements or qualitative material.
If you spot an error that warrants correction, please contact the editor at editorial-team@simplywallst.com. This article by Simply Wall St is general in nature. It does not constitute a recommendation to buy or sell any stock, and does not take account of your objectives, or your financial situation. Simply Wall St has no position in the stocks mentioned. Thank you for reading.
