
 Yahoo Finance
 Introducing Vector (NZSE:VCT), A Stock That Climbed 21% In The Last Three Years
Low-cost index funds make it easy to achieve average market returns. But if you invest in individual stocks, some are likely to underperform. For example, the Vector Limited (NZSE:VCT) share price return of 21% over three years lags the market return in the same period. In the last year the stock price gained, albeit only 2.8%.
Check out our latest analysis for Vector
There is no denying that markets are sometimes efficient, but prices do not always reflect underlying business performance. One imperfect but simple way to consider how the market perception of a company has shifted is to compare the change in the earnings per share (EPS) with the share price movement.
During the three years of share price growth, Vector actually saw its earnings per share (EPS) drop 5.9% per year.
Thus, it seems unlikely that the market is focussed on EPS growth at the moment. Therefore, we think it's worth considering other metrics as well.
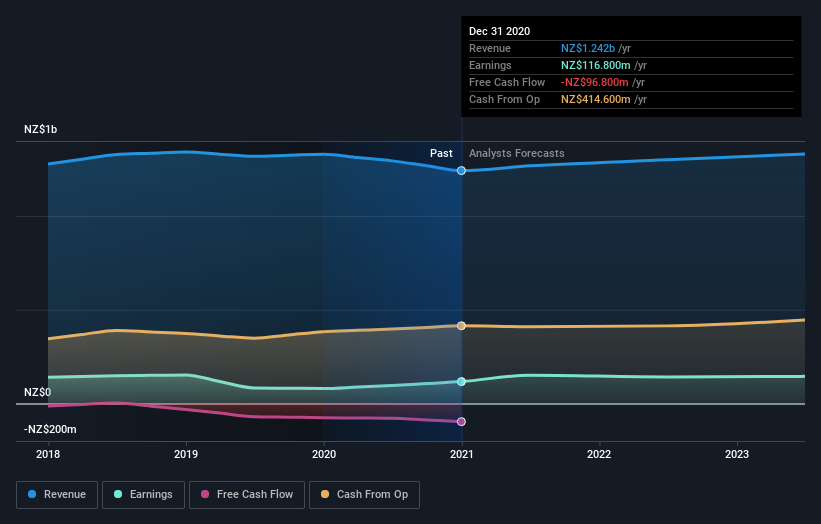
We doubt the dividend payments explain the share price rise, since we don't see any improvement in that regard. The revenue decline of 1.0% would scarcely encourage buyers. So it isn't easy to explain why the share price is up - maybe a closer look at revenue and earnings trends could help us understand.
The image below shows how earnings and revenue have tracked over time (if you click on the image you can see greater detail).
We know that Vector has improved its bottom line lately, but what does the future have in store? You can see what analysts are predicting for Vector in this interactive graph of future profit estimates.
What About Dividends?
When looking at investment returns, it is important to consider the difference between total shareholder return (TSR) and share price return. The TSR incorporates the value of any spin-offs or discounted capital raisings, along with any dividends, based on the assumption that the dividends are reinvested. Arguably, the TSR gives a more comprehensive picture of the return generated by a stock. We note that for Vector the TSR over the last 3 years was 40%, which is better than the share price return mentioned above. And there's no prize for guessing that the dividend payments largely explain the divergence!
A Different Perspective
Vector shareholders are up 7.0% for the year (even including dividends). Unfortunately this falls short of the market return. On the bright side, the longer term returns (running at about 8% a year, over half a decade) look better. Maybe the share price is just taking a breather while the business executes on its growth strategy. While it is well worth considering the different impacts that market conditions can have on the share price, there are other factors that are even more important. For example, we've discovered 2 warning signs for Vector that you should be aware of before investing here.
If you would prefer to check out another company -- one with potentially superior financials -- then do not miss this free list of companies that have proven they can grow earnings.
Please note, the market returns quoted in this article reflect the market weighted average returns of stocks that currently trade on NZ exchanges.
This article by Simply Wall St is general in nature. It does not constitute a recommendation to buy or sell any stock, and does not take account of your objectives, or your financial situation. We aim to bring you long-term focused analysis driven by fundamental data. Note that our analysis may not factor in the latest price-sensitive company announcements or qualitative material. Simply Wall St has no position in any stocks mentioned.
Have feedback on this article? Concerned about the content? Get in touch with us directly. Alternatively, email editorial-team (at) simplywallst.com.
