
 Yahoo Finance
 Investing in Bonanza Creek Energy (NYSE:BCEI) a year ago would have delivered you a 151% gain
When you buy shares in a company, there is always a risk that the price drops to zero. On the other hand, if you find a high quality business to buy (at the right price) you can more than double your money! Take, for example Bonanza Creek Energy, Inc. (NYSE:BCEI). Its share price is already up an impressive 147% in the last twelve months. In more good news, the share price has risen 16% in thirty days. Also impressive, the stock is up 80% over three years, making long term shareholders happy, too.
Let's take a look at the underlying fundamentals over the longer term, and see if they've been consistent with shareholders returns.
View our latest analysis for Bonanza Creek Energy
To paraphrase Benjamin Graham: Over the short term the market is a voting machine, but over the long term it's a weighing machine. One way to examine how market sentiment has changed over time is to look at the interaction between a company's share price and its earnings per share (EPS).
During the last year, Bonanza Creek Energy actually saw its earnings per share drop 53%.
Given the share price gain, we doubt the market is measuring progress with EPS. Indeed, when EPS is declining but the share price is up, it often means the market is considering other factors.
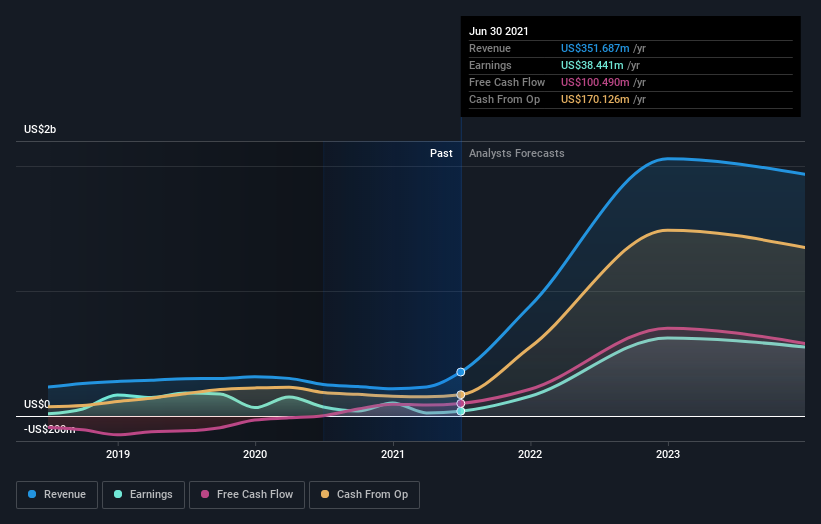
However the year on year revenue growth of 40% would help. Many businesses do go through a phase where they have to forgo some profits to drive business development, and sometimes its for the best.
You can see below how earnings and revenue have changed over time (discover the exact values by clicking on the image).
If you are thinking of buying or selling Bonanza Creek Energy stock, you should check out this FREE detailed report on its balance sheet.
What About Dividends?
As well as measuring the share price return, investors should also consider the total shareholder return (TSR). The TSR incorporates the value of any spin-offs or discounted capital raisings, along with any dividends, based on the assumption that the dividends are reinvested. Arguably, the TSR gives a more comprehensive picture of the return generated by a stock. In the case of Bonanza Creek Energy, it has a TSR of 151% for the last 1 year. That exceeds its share price return that we previously mentioned. The dividends paid by the company have thusly boosted the total shareholder return.
A Different Perspective
We're pleased to report that Bonanza Creek Energy shareholders have received a total shareholder return of 151% over one year. And that does include the dividend. That certainly beats the loss of about 9% per year over the last half decade. This makes us a little wary, but the business might have turned around its fortunes. While it is well worth considering the different impacts that market conditions can have on the share price, there are other factors that are even more important. Consider risks, for instance. Every company has them, and we've spotted 6 warning signs for Bonanza Creek Energy you should know about.
Of course, you might find a fantastic investment by looking elsewhere. So take a peek at this free list of companies we expect will grow earnings.
Please note, the market returns quoted in this article reflect the market weighted average returns of stocks that currently trade on US exchanges.
This article by Simply Wall St is general in nature. We provide commentary based on historical data and analyst forecasts only using an unbiased methodology and our articles are not intended to be financial advice. It does not constitute a recommendation to buy or sell any stock, and does not take account of your objectives, or your financial situation. We aim to bring you long-term focused analysis driven by fundamental data. Note that our analysis may not factor in the latest price-sensitive company announcements or qualitative material. Simply Wall St has no position in any stocks mentioned.
Have feedback on this article? Concerned about the content? Get in touch with us directly. Alternatively, email editorial-team (at) simplywallst.com.
