
 Yahoo Finance
 Investing in Corby Spirit and Wine (TSE:CSW.A) five years ago would have delivered you a 5.9% gain
For many, the main point of investing is to generate higher returns than the overall market. But the main game is to find enough winners to more than offset the losers So we wouldn't blame long term Corby Spirit and Wine Limited (TSE:CSW.A) shareholders for doubting their decision to hold, with the stock down 18% over a half decade.
It's worthwhile assessing if the company's economics have been moving in lockstep with these underwhelming shareholder returns, or if there is some disparity between the two. So let's do just that.
Check out our latest analysis for Corby Spirit and Wine
In his essay The Superinvestors of Graham-and-Doddsville Warren Buffett described how share prices do not always rationally reflect the value of a business. One imperfect but simple way to consider how the market perception of a company has shifted is to compare the change in the earnings per share (EPS) with the share price movement.
During the five years over which the share price declined, Corby Spirit and Wine's earnings per share (EPS) dropped by 1.8% each year. This reduction in EPS is less than the 4% annual reduction in the share price. So it seems the market was too confident about the business, in the past.
You can see how EPS has changed over time in the image below (click on the chart to see the exact values).
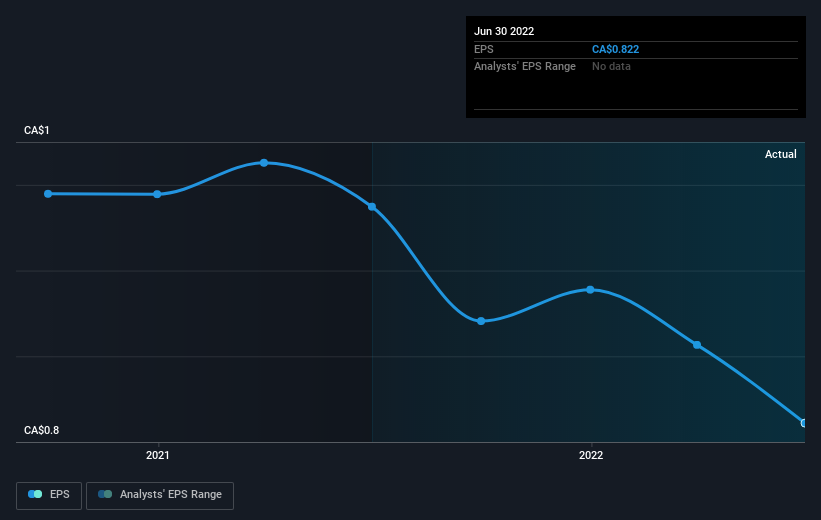
This free interactive report on Corby Spirit and Wine's earnings, revenue and cash flow is a great place to start, if you want to investigate the stock further.
What About Dividends?
As well as measuring the share price return, investors should also consider the total shareholder return (TSR). Whereas the share price return only reflects the change in the share price, the TSR includes the value of dividends (assuming they were reinvested) and the benefit of any discounted capital raising or spin-off. It's fair to say that the TSR gives a more complete picture for stocks that pay a dividend. We note that for Corby Spirit and Wine the TSR over the last 5 years was 5.9%, which is better than the share price return mentioned above. The dividends paid by the company have thusly boosted the total shareholder return.
A Different Perspective
We're pleased to report that Corby Spirit and Wine shareholders have received a total shareholder return of 2.4% over one year. That's including the dividend. That's better than the annualised return of 1.2% over half a decade, implying that the company is doing better recently. Someone with an optimistic perspective could view the recent improvement in TSR as indicating that the business itself is getting better with time. It's always interesting to track share price performance over the longer term. But to understand Corby Spirit and Wine better, we need to consider many other factors. To that end, you should be aware of the 2 warning signs we've spotted with Corby Spirit and Wine .
For those who like to find winning investments this free list of growing companies with recent insider purchasing, could be just the ticket.
Please note, the market returns quoted in this article reflect the market weighted average returns of stocks that currently trade on CA exchanges.
Have feedback on this article? Concerned about the content? Get in touch with us directly. Alternatively, email editorial-team (at) simplywallst.com.
This article by Simply Wall St is general in nature. We provide commentary based on historical data and analyst forecasts only using an unbiased methodology and our articles are not intended to be financial advice. It does not constitute a recommendation to buy or sell any stock, and does not take account of your objectives, or your financial situation. We aim to bring you long-term focused analysis driven by fundamental data. Note that our analysis may not factor in the latest price-sensitive company announcements or qualitative material. Simply Wall St has no position in any stocks mentioned.
Join A Paid User Research Session
You’ll receive a US$30 Amazon Gift card for 1 hour of your time while helping us build better investing tools for the individual investors like yourself. Sign up here
