
 Yahoo Finance
 Investing in Escalade (NASDAQ:ESCA) three years ago would have delivered you a 59% gain
By buying an index fund, you can roughly match the market return with ease. But if you choose individual stocks with prowess, you can make superior returns. For example, the Escalade, Incorporated (NASDAQ:ESCA) share price is up 41% in the last three years, clearly besting the market return of around 24% (not including dividends).
With that in mind, it's worth seeing if the company's underlying fundamentals have been the driver of long term performance, or if there are some discrepancies.
View our latest analysis for Escalade
In his essay The Superinvestors of Graham-and-Doddsville Warren Buffett described how share prices do not always rationally reflect the value of a business. One imperfect but simple way to consider how the market perception of a company has shifted is to compare the change in the earnings per share (EPS) with the share price movement.
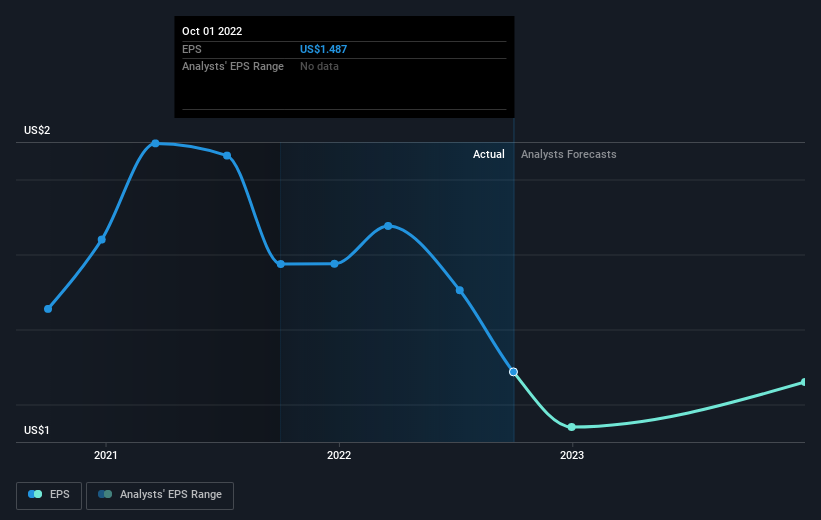
Escalade was able to grow its EPS at 37% per year over three years, sending the share price higher. This EPS growth is higher than the 12% average annual increase in the share price. So one could reasonably conclude that the market has cooled on the stock. This cautious sentiment is reflected in its (fairly low) P/E ratio of 8.36.
You can see how EPS has changed over time in the image below (click on the chart to see the exact values).
It is of course excellent to see how Escalade has grown profits over the years, but the future is more important for shareholders. If you are thinking of buying or selling Escalade stock, you should check out this FREE detailed report on its balance sheet.
What About Dividends?
When looking at investment returns, it is important to consider the difference between total shareholder return (TSR) and share price return. The TSR incorporates the value of any spin-offs or discounted capital raisings, along with any dividends, based on the assumption that the dividends are reinvested. It's fair to say that the TSR gives a more complete picture for stocks that pay a dividend. As it happens, Escalade's TSR for the last 3 years was 59%, which exceeds the share price return mentioned earlier. And there's no prize for guessing that the dividend payments largely explain the divergence!
A Different Perspective
While it's certainly disappointing to see that Escalade shares lost 6.4% throughout the year, that wasn't as bad as the market loss of 7.7%. Of course, the long term returns are far more important and the good news is that over five years, the stock has returned 4% for each year. In the best case scenario the last year is just a temporary blip on the journey to a brighter future. It's always interesting to track share price performance over the longer term. But to understand Escalade better, we need to consider many other factors. Even so, be aware that Escalade is showing 2 warning signs in our investment analysis , and 1 of those is a bit unpleasant...
If you like to buy stocks alongside management, then you might just love this free list of companies. (Hint: insiders have been buying them).
Please note, the market returns quoted in this article reflect the market weighted average returns of stocks that currently trade on US exchanges.
Have feedback on this article? Concerned about the content? Get in touch with us directly. Alternatively, email editorial-team (at) simplywallst.com.
This article by Simply Wall St is general in nature. We provide commentary based on historical data and analyst forecasts only using an unbiased methodology and our articles are not intended to be financial advice. It does not constitute a recommendation to buy or sell any stock, and does not take account of your objectives, or your financial situation. We aim to bring you long-term focused analysis driven by fundamental data. Note that our analysis may not factor in the latest price-sensitive company announcements or qualitative material. Simply Wall St has no position in any stocks mentioned.
Join A Paid User Research Session
You’ll receive a US$30 Amazon Gift card for 1 hour of your time while helping us build better investing tools for the individual investors like yourself. Sign up here
