
 Yahoo Finance
 Investors Could Be Concerned With Compass Minerals International's (NYSE:CMP) Returns On Capital
When it comes to investing, there are some useful financial metrics that can warn us when a business is potentially in trouble. When we see a declining return on capital employed (ROCE) in conjunction with a declining base of capital employed, that's often how a mature business shows signs of aging. Ultimately this means that the company is earning less per dollar invested and on top of that, it's shrinking its base of capital employed. And from a first read, things don't look too good at Compass Minerals International (NYSE:CMP), so let's see why.
Understanding Return On Capital Employed (ROCE)
If you haven't worked with ROCE before, it measures the 'return' (pre-tax profit) a company generates from capital employed in its business. The formula for this calculation on Compass Minerals International is:
Return on Capital Employed = Earnings Before Interest and Tax (EBIT) ÷ (Total Assets - Current Liabilities)
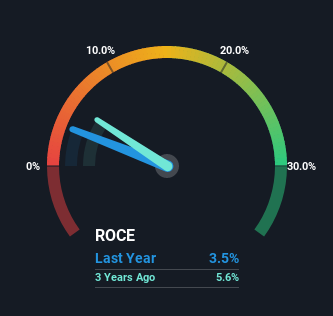
0.035 = US$55m ÷ (US$1.8b - US$219m) (Based on the trailing twelve months to December 2022).
So, Compass Minerals International has an ROCE of 3.5%. In absolute terms, that's a low return and it also under-performs the Metals and Mining industry average of 15%.
View our latest analysis for Compass Minerals International
In the above chart we have measured Compass Minerals International's prior ROCE against its prior performance, but the future is arguably more important. If you'd like to see what analysts are forecasting going forward, you should check out our free report for Compass Minerals International.
How Are Returns Trending?
We aren't inspired by the trend, given ROCE has reduced by 49% over the last five years and Compass Minerals International is applying -33% less capital in the business, even after the capital raising they conducted (prior to their latest reported figures).
What We Can Learn From Compass Minerals International's ROCE
To see Compass Minerals International reducing the capital employed in the business in tandem with diminishing returns, is concerning. Investors haven't taken kindly to these developments, since the stock has declined 37% from where it was five years ago. With underlying trends that aren't great in these areas, we'd consider looking elsewhere.
Since virtually every company faces some risks, it's worth knowing what they are, and we've spotted 3 warning signs for Compass Minerals International (of which 1 shouldn't be ignored!) that you should know about.
While Compass Minerals International may not currently earn the highest returns, we've compiled a list of companies that currently earn more than 25% return on equity. Check out this free list here.
Have feedback on this article? Concerned about the content? Get in touch with us directly. Alternatively, email editorial-team (at) simplywallst.com.
This article by Simply Wall St is general in nature. We provide commentary based on historical data and analyst forecasts only using an unbiased methodology and our articles are not intended to be financial advice. It does not constitute a recommendation to buy or sell any stock, and does not take account of your objectives, or your financial situation. We aim to bring you long-term focused analysis driven by fundamental data. Note that our analysis may not factor in the latest price-sensitive company announcements or qualitative material. Simply Wall St has no position in any stocks mentioned.
Join A Paid User Research Session
You’ll receive a US$30 Amazon Gift card for 1 hour of your time while helping us build better investing tools for the individual investors like yourself. Sign up here
