
 Yahoo Finance
 Investors Could Be Concerned With Midwich Group's (LON:MIDW) Returns On Capital
Finding a business that has the potential to grow substantially is not easy, but it is possible if we look at a few key financial metrics. Firstly, we'll want to see a proven return on capital employed (ROCE) that is increasing, and secondly, an expanding base of capital employed. This shows us that it's a compounding machine, able to continually reinvest its earnings back into the business and generate higher returns. However, after investigating Midwich Group (LON:MIDW), we don't think it's current trends fit the mold of a multi-bagger.
What Is Return On Capital Employed (ROCE)?
For those who don't know, ROCE is a measure of a company's yearly pre-tax profit (its return), relative to the capital employed in the business. The formula for this calculation on Midwich Group is:
Return on Capital Employed = Earnings Before Interest and Tax (EBIT) ÷ (Total Assets - Current Liabilities)
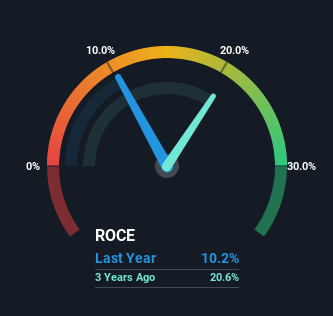
0.10 = UK£27m ÷ (UK£560m - UK£300m) (Based on the trailing twelve months to June 2022).
Therefore, Midwich Group has an ROCE of 10%. By itself that's a normal return on capital and it's in line with the industry's average returns of 9.9%.
Check out our latest analysis for Midwich Group
Above you can see how the current ROCE for Midwich Group compares to its prior returns on capital, but there's only so much you can tell from the past. If you'd like to see what analysts are forecasting going forward, you should check out our free report for Midwich Group.
What Does the ROCE Trend For Midwich Group Tell Us?
When we looked at the ROCE trend at Midwich Group, we didn't gain much confidence. To be more specific, ROCE has fallen from 31% over the last five years. Although, given both revenue and the amount of assets employed in the business have increased, it could suggest the company is investing in growth, and the extra capital has led to a short-term reduction in ROCE. And if the increased capital generates additional returns, the business, and thus shareholders, will benefit in the long run.
On a related note, Midwich Group has decreased its current liabilities to 54% of total assets. So we could link some of this to the decrease in ROCE. What's more, this can reduce some aspects of risk to the business because now the company's suppliers or short-term creditors are funding less of its operations. Since the business is basically funding more of its operations with it's own money, you could argue this has made the business less efficient at generating ROCE. Either way, they're still at a pretty high level, so we'd like to see them fall further if possible.
Our Take On Midwich Group's ROCE
Even though returns on capital have fallen in the short term, we find it promising that revenue and capital employed have both increased for Midwich Group. These trends don't appear to have influenced returns though, because the total return from the stock has been mostly flat over the last five years. As a result, we'd recommend researching this stock further to uncover what other fundamentals of the business can show us.
On a final note, we found 2 warning signs for Midwich Group (1 is concerning) you should be aware of.
If you want to search for solid companies with great earnings, check out this free list of companies with good balance sheets and impressive returns on equity.
Have feedback on this article? Concerned about the content? Get in touch with us directly. Alternatively, email editorial-team (at) simplywallst.com.
This article by Simply Wall St is general in nature. We provide commentary based on historical data and analyst forecasts only using an unbiased methodology and our articles are not intended to be financial advice. It does not constitute a recommendation to buy or sell any stock, and does not take account of your objectives, or your financial situation. We aim to bring you long-term focused analysis driven by fundamental data. Note that our analysis may not factor in the latest price-sensitive company announcements or qualitative material. Simply Wall St has no position in any stocks mentioned.
Join A Paid User Research Session
You’ll receive a US$30 Amazon Gift card for 1 hour of your time while helping us build better investing tools for the individual investors like yourself. Sign up here
