
 Yahoo Finance
 Investors in Doximity (NYSE:DOCS) have unfortunately lost 50% over the last year
While it may not be enough for some shareholders, we think it is good to see the Doximity, Inc. (NYSE:DOCS) share price up 19% in a single quarter. But that isn't much consolation to those who have suffered through the declines of the last year. Like a receding glacier in a warming world, the share price has melted 50% in that period. The share price recovery is not so impressive when you consider the fall. It may be that the fall was an overreaction.
It's worthwhile assessing if the company's economics have been moving in lockstep with these underwhelming shareholder returns, or if there is some disparity between the two. So let's do just that.
View our latest analysis for Doximity
To paraphrase Benjamin Graham: Over the short term the market is a voting machine, but over the long term it's a weighing machine. One way to examine how market sentiment has changed over time is to look at the interaction between a company's share price and its earnings per share (EPS).
During the unfortunate twelve months during which the Doximity share price fell, it actually saw its earnings per share (EPS) improve by 86%. Of course, the situation might betray previous over-optimism about growth.
It's fair to say that the share price does not seem to be reflecting the EPS growth. So it's easy to justify a look at some other metrics.
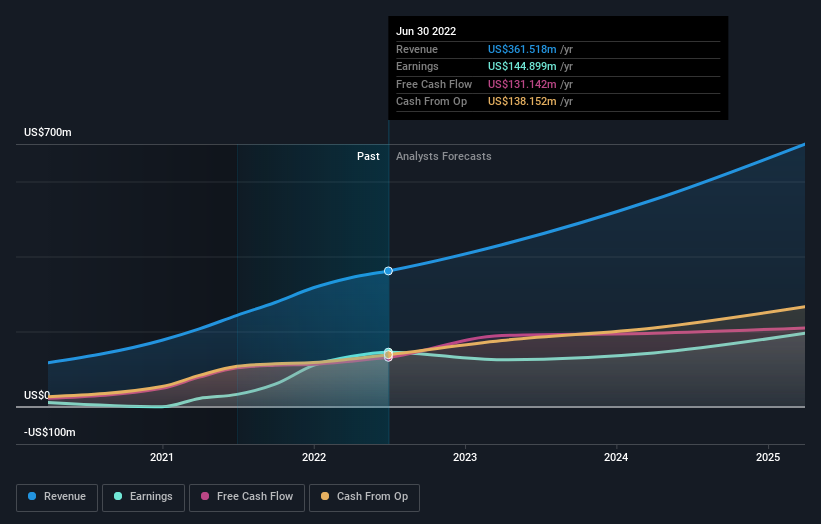
Doximity managed to grow revenue over the last year, which is usually a real positive. Since the fundamental metrics don't readily explain the share price drop, there might be an opportunity if the market has overreacted.
You can see below how earnings and revenue have changed over time (discover the exact values by clicking on the image).
It's probably worth noting we've seen significant insider buying in the last quarter, which we consider a positive. That said, we think earnings and revenue growth trends are even more important factors to consider. You can see what analysts are predicting for Doximity in this interactive graph of future profit estimates.
A Different Perspective
Doximity shareholders are down 50% for the year, even worse than the market loss of 8.9%. There's no doubt that's a disappointment, but the stock may well have fared better in a stronger market. It's great to see a nice little 19% rebound in the last three months. This could just be a bounce because the selling was too aggressive, but fingers crossed it's the start of a new trend. It's always interesting to track share price performance over the longer term. But to understand Doximity better, we need to consider many other factors. For instance, we've identified 2 warning signs for Doximity (1 is concerning) that you should be aware of.
There are plenty of other companies that have insiders buying up shares. You probably do not want to miss this free list of growing companies that insiders are buying.
Please note, the market returns quoted in this article reflect the market weighted average returns of stocks that currently trade on US exchanges.
Have feedback on this article? Concerned about the content? Get in touch with us directly. Alternatively, email editorial-team (at) simplywallst.com.
This article by Simply Wall St is general in nature. We provide commentary based on historical data and analyst forecasts only using an unbiased methodology and our articles are not intended to be financial advice. It does not constitute a recommendation to buy or sell any stock, and does not take account of your objectives, or your financial situation. We aim to bring you long-term focused analysis driven by fundamental data. Note that our analysis may not factor in the latest price-sensitive company announcements or qualitative material. Simply Wall St has no position in any stocks mentioned.
Join A Paid User Research Session
You’ll receive a US$30 Amazon Gift card for 1 hour of your time while helping us build better investing tools for the individual investors like yourself. Sign up here
