
 Yahoo Finance
 Investors in Flowtech Fluidpower (LON:FLO) have unfortunately lost 12% over the last five years
It is doubtless a positive to see that the Flowtech Fluidpower plc (LON:FLO) share price has gained some 37% in the last three months. But that doesn't change the fact that the returns over the last five years have been less than pleasing. You would have done a lot better buying an index fund, since the stock has dropped 17% in that half decade.
Since shareholders are down over the longer term, lets look at the underlying fundamentals over the that time and see if they've been consistent with returns.
View our latest analysis for Flowtech Fluidpower
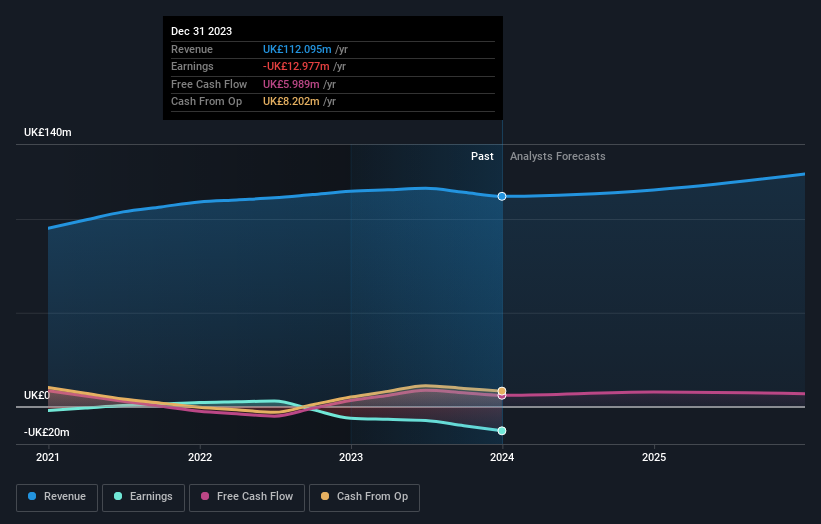
Flowtech Fluidpower isn't currently profitable, so most analysts would look to revenue growth to get an idea of how fast the underlying business is growing. When a company doesn't make profits, we'd generally hope to see good revenue growth. As you can imagine, fast revenue growth, when maintained, often leads to fast profit growth.
Over five years, Flowtech Fluidpower grew its revenue at 0.9% per year. That's not a very high growth rate considering it doesn't make profits. Given this fairly low revenue growth (and lack of profits), it's not particularly surprising to see the stock down 3% (annualized) in the same time frame. The key question is whether the company can make it to profitability, and beyond, without trouble. It could be worth putting it on your watchlist and revisiting when it makes its maiden profit.
You can see below how earnings and revenue have changed over time (discover the exact values by clicking on the image).
We consider it positive that insiders have made significant purchases in the last year. Even so, future earnings will be far more important to whether current shareholders make money. You can see what analysts are predicting for Flowtech Fluidpower in this interactive graph of future profit estimates.
What About Dividends?
When looking at investment returns, it is important to consider the difference between total shareholder return (TSR) and share price return. The TSR is a return calculation that accounts for the value of cash dividends (assuming that any dividend received was reinvested) and the calculated value of any discounted capital raisings and spin-offs. It's fair to say that the TSR gives a more complete picture for stocks that pay a dividend. As it happens, Flowtech Fluidpower's TSR for the last 5 years was -12%, which exceeds the share price return mentioned earlier. And there's no prize for guessing that the dividend payments largely explain the divergence!
A Different Perspective
Flowtech Fluidpower shareholders are up 5.6% for the year (even including dividends). But that return falls short of the market. But at least that's still a gain! Over five years the TSR has been a reduction of 2% per year, over five years. So this might be a sign the business has turned its fortunes around. It's always interesting to track share price performance over the longer term. But to understand Flowtech Fluidpower better, we need to consider many other factors. To that end, you should learn about the 3 warning signs we've spotted with Flowtech Fluidpower (including 1 which is potentially serious) .
There are plenty of other companies that have insiders buying up shares. You probably do not want to miss this free list of undervalued small cap companies that insiders are buying.
Please note, the market returns quoted in this article reflect the market weighted average returns of stocks that currently trade on British exchanges.
Have feedback on this article? Concerned about the content? Get in touch with us directly. Alternatively, email editorial-team (at) simplywallst.com.
This article by Simply Wall St is general in nature. We provide commentary based on historical data and analyst forecasts only using an unbiased methodology and our articles are not intended to be financial advice. It does not constitute a recommendation to buy or sell any stock, and does not take account of your objectives, or your financial situation. We aim to bring you long-term focused analysis driven by fundamental data. Note that our analysis may not factor in the latest price-sensitive company announcements or qualitative material. Simply Wall St has no position in any stocks mentioned.
