
 Yahoo Finance
 Investors Holding Back On Kerjaya Prospek Group Berhad (KLSE:KERJAYA)
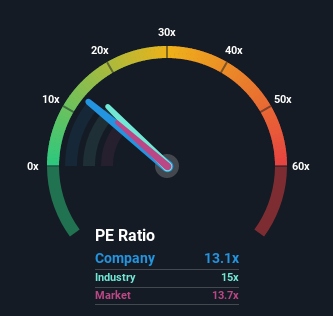
It's not a stretch to say that Kerjaya Prospek Group Berhad's (KLSE:KERJAYA) price-to-earnings (or "P/E") ratio of 13.1x right now seems quite "middle-of-the-road" compared to the market in Malaysia, where the median P/E ratio is around 14x. While this might not raise any eyebrows, if the P/E ratio is not justified investors could be missing out on a potential opportunity or ignoring looming disappointment.
Recent earnings growth for Kerjaya Prospek Group Berhad has been in line with the market. The P/E is probably moderate because investors think this modest earnings performance will continue. If you like the company, you'd be hoping this can at least be maintained so that you could pick up some stock while it's not quite in favour.
Check out our latest analysis for Kerjaya Prospek Group Berhad
Keen to find out how analysts think Kerjaya Prospek Group Berhad's future stacks up against the industry? In that case, our free report is a great place to start.
How Is Kerjaya Prospek Group Berhad's Growth Trending?
The only time you'd be comfortable seeing a P/E like Kerjaya Prospek Group Berhad's is when the company's growth is tracking the market closely.
If we review the last year of earnings growth, the company posted a terrific increase of 23%. Still, incredibly EPS has fallen 17% in total from three years ago, which is quite disappointing. Accordingly, shareholders would have felt downbeat about the medium-term rates of earnings growth.
Looking ahead now, EPS is anticipated to climb by 19% during the coming year according to the six analysts following the company. With the market only predicted to deliver 8.7%, the company is positioned for a stronger earnings result.
In light of this, it's curious that Kerjaya Prospek Group Berhad's P/E sits in line with the majority of other companies. It may be that most investors aren't convinced the company can achieve future growth expectations.
What We Can Learn From Kerjaya Prospek Group Berhad's P/E?
Generally, our preference is to limit the use of the price-to-earnings ratio to establishing what the market thinks about the overall health of a company.
We've established that Kerjaya Prospek Group Berhad currently trades on a lower than expected P/E since its forecast growth is higher than the wider market. When we see a strong earnings outlook with faster-than-market growth, we assume potential risks are what might be placing pressure on the P/E ratio. It appears some are indeed anticipating earnings instability, because these conditions should normally provide a boost to the share price.
There are also other vital risk factors to consider before investing and we've discovered 1 warning sign for Kerjaya Prospek Group Berhad that you should be aware of.
If you're unsure about the strength of Kerjaya Prospek Group Berhad's business, why not explore our interactive list of stocks with solid business fundamentals for some other companies you may have missed.
Have feedback on this article? Concerned about the content? Get in touch with us directly. Alternatively, email editorial-team (at) simplywallst.com.
This article by Simply Wall St is general in nature. We provide commentary based on historical data and analyst forecasts only using an unbiased methodology and our articles are not intended to be financial advice. It does not constitute a recommendation to buy or sell any stock, and does not take account of your objectives, or your financial situation. We aim to bring you long-term focused analysis driven by fundamental data. Note that our analysis may not factor in the latest price-sensitive company announcements or qualitative material. Simply Wall St has no position in any stocks mentioned.
Join A Paid User Research Session
You’ll receive a US$30 Amazon Gift card for 1 hour of your time while helping us build better investing tools for the individual investors like yourself. Sign up here
