
 Yahoo Finance
 Investors in Liquidity Services (NASDAQ:LQDT) have made a impressive return of 196% over the past five years
While Liquidity Services, Inc. (NASDAQ:LQDT) shareholders are probably generally happy, the stock hasn't had particularly good run recently, with the share price falling 16% in the last quarter. But in stark contrast, the returns over the last half decade have impressed. It's fair to say most would be happy with 196% the gain in that time. To some, the recent pullback wouldn't be surprising after such a fast rise. Ultimately business performance will determine whether the stock price continues the positive long term trend. Unfortunately not all shareholders will have held it for the long term, so spare a thought for those caught in the 37% decline over the last twelve months.
So let's assess the underlying fundamentals over the last 5 years and see if they've moved in lock-step with shareholder returns.
View our latest analysis for Liquidity Services
While the efficient markets hypothesis continues to be taught by some, it has been proven that markets are over-reactive dynamic systems, and investors are not always rational. One way to examine how market sentiment has changed over time is to look at the interaction between a company's share price and its earnings per share (EPS).
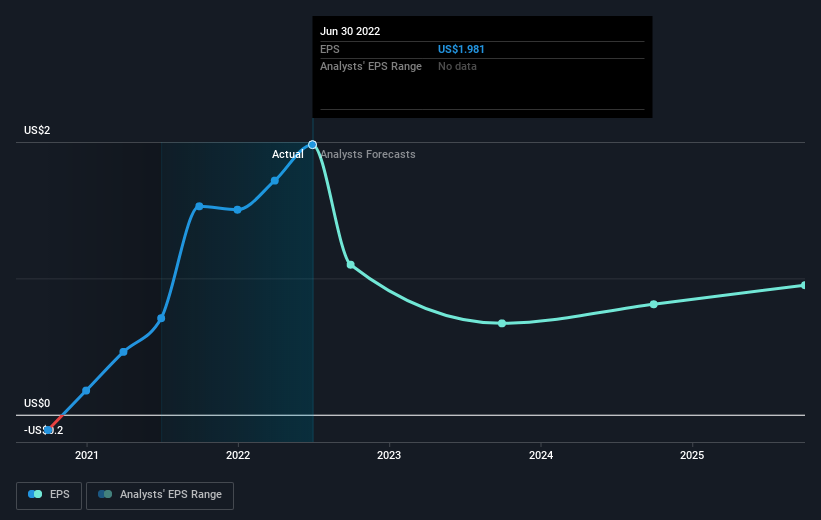
During the five years of share price growth, Liquidity Services moved from a loss to profitability. Sometimes, the start of profitability is a major inflection point that can signal fast earnings growth to come, which in turn justifies very strong share price gains.
You can see below how EPS has changed over time (discover the exact values by clicking on the image).
We know that Liquidity Services has improved its bottom line over the last three years, but what does the future have in store? If you are thinking of buying or selling Liquidity Services stock, you should check out this FREE detailed report on its balance sheet.
A Different Perspective
While the broader market lost about 21% in the twelve months, Liquidity Services shareholders did even worse, losing 37%. Having said that, it's inevitable that some stocks will be oversold in a falling market. The key is to keep your eyes on the fundamental developments. Longer term investors wouldn't be so upset, since they would have made 24%, each year, over five years. It could be that the recent sell-off is an opportunity, so it may be worth checking the fundamental data for signs of a long term growth trend. I find it very interesting to look at share price over the long term as a proxy for business performance. But to truly gain insight, we need to consider other information, too. Take risks, for example - Liquidity Services has 3 warning signs (and 2 which make us uncomfortable) we think you should know about.
If you are like me, then you will not want to miss this free list of growing companies that insiders are buying.
Please note, the market returns quoted in this article reflect the market weighted average returns of stocks that currently trade on US exchanges.
Have feedback on this article? Concerned about the content? Get in touch with us directly. Alternatively, email editorial-team (at) simplywallst.com.
This article by Simply Wall St is general in nature. We provide commentary based on historical data and analyst forecasts only using an unbiased methodology and our articles are not intended to be financial advice. It does not constitute a recommendation to buy or sell any stock, and does not take account of your objectives, or your financial situation. We aim to bring you long-term focused analysis driven by fundamental data. Note that our analysis may not factor in the latest price-sensitive company announcements or qualitative material. Simply Wall St has no position in any stocks mentioned.
Join A Paid User Research Session
You’ll receive a US$30 Amazon Gift card for 1 hour of your time while helping us build better investing tools for the individual investors like yourself. Sign up here
