
 Yahoo Finance
 Investors in Loma Negra Compañía Industrial Argentina Sociedad Anónima (NYSE:LOMA) have made a return of 8.0% over the past year
Loma Negra Compañía Industrial Argentina Sociedad Anónima (NYSE:LOMA) shareholders should be happy to see the share price up 20% in the last quarter.
Now let's have a look at the company's fundamentals, and see if the long term shareholder return has matched the performance of the underlying business.
Check out our latest analysis for Loma Negra Compañía Industrial Argentina Sociedad Anónima
To paraphrase Benjamin Graham: Over the short term the market is a voting machine, but over the long term it's a weighing machine. One way to examine how market sentiment has changed over time is to look at the interaction between a company's share price and its earnings per share (EPS).
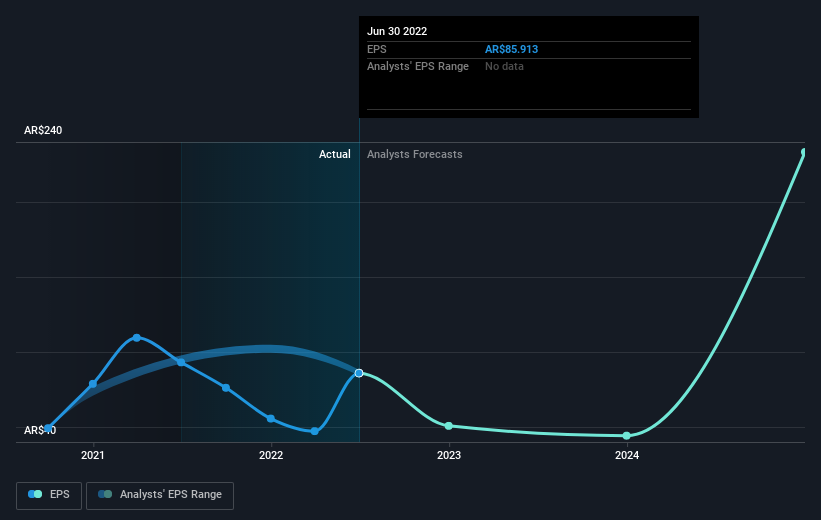
Unhappily, Loma Negra Compañía Industrial Argentina Sociedad Anónima had to report a 7.7% decline in EPS over the last year. The share price decline of 12% is actually more than the EPS drop. This suggests the EPS fall has made some shareholders are more nervous about the business. The less favorable sentiment is reflected in its current P/E ratio of 10.66.
You can see below how EPS has changed over time (discover the exact values by clicking on the image).
This free interactive report on Loma Negra Compañía Industrial Argentina Sociedad Anónima's earnings, revenue and cash flow is a great place to start, if you want to investigate the stock further.
What About Dividends?
It is important to consider the total shareholder return, as well as the share price return, for any given stock. The TSR incorporates the value of any spin-offs or discounted capital raisings, along with any dividends, based on the assumption that the dividends are reinvested. It's fair to say that the TSR gives a more complete picture for stocks that pay a dividend. In the case of Loma Negra Compañía Industrial Argentina Sociedad Anónima, it has a TSR of 8.0% for the last 1 year. That exceeds its share price return that we previously mentioned. The dividends paid by the company have thusly boosted the total shareholder return.
A Different Perspective
It's nice to see that Loma Negra Compañía Industrial Argentina Sociedad Anónima shareholders have gained 8.0% (in total) over the last year. That's including the dividend. The TSR has been even better over three years, coming in at 10% per year. I find it very interesting to look at share price over the long term as a proxy for business performance. But to truly gain insight, we need to consider other information, too. Consider risks, for instance. Every company has them, and we've spotted 1 warning sign for Loma Negra Compañía Industrial Argentina Sociedad Anónima you should know about.
But note: Loma Negra Compañía Industrial Argentina Sociedad Anónima may not be the best stock to buy. So take a peek at this free list of interesting companies with past earnings growth (and further growth forecast).
Please note, the market returns quoted in this article reflect the market weighted average returns of stocks that currently trade on US exchanges.
Have feedback on this article? Concerned about the content? Get in touch with us directly. Alternatively, email editorial-team (at) simplywallst.com.
This article by Simply Wall St is general in nature. We provide commentary based on historical data and analyst forecasts only using an unbiased methodology and our articles are not intended to be financial advice. It does not constitute a recommendation to buy or sell any stock, and does not take account of your objectives, or your financial situation. We aim to bring you long-term focused analysis driven by fundamental data. Note that our analysis may not factor in the latest price-sensitive company announcements or qualitative material. Simply Wall St has no position in any stocks mentioned.
Join A Paid User Research Session
You’ll receive a US$30 Amazon Gift card for 1 hour of your time while helping us build better investing tools for the individual investors like yourself. Sign up here
