
 Yahoo Finance
 Some Investors May Be Worried About Japan Foods Holding's (Catalist:5OI) Returns On Capital
If we want to find a stock that could multiply over the long term, what are the underlying trends we should look for? One common approach is to try and find a company with returns on capital employed (ROCE) that are increasing, in conjunction with a growing amount of capital employed. Ultimately, this demonstrates that it's a business that is reinvesting profits at increasing rates of return. Although, when we looked at Japan Foods Holding (Catalist:5OI), it didn't seem to tick all of these boxes.
What Is Return On Capital Employed (ROCE)?
For those that aren't sure what ROCE is, it measures the amount of pre-tax profits a company can generate from the capital employed in its business. Analysts use this formula to calculate it for Japan Foods Holding:
Return on Capital Employed = Earnings Before Interest and Tax (EBIT) ÷ (Total Assets - Current Liabilities)
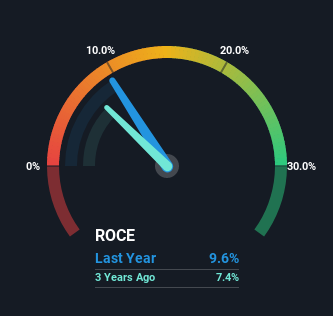
0.096 = S$5.1m ÷ (S$82m - S$28m) (Based on the trailing twelve months to September 2022).
So, Japan Foods Holding has an ROCE of 9.6%. In absolute terms, that's a low return, but it's much better than the Hospitality industry average of 1.0%.
Check out our latest analysis for Japan Foods Holding
Above you can see how the current ROCE for Japan Foods Holding compares to its prior returns on capital, but there's only so much you can tell from the past. If you're interested, you can view the analysts predictions in our free report on analyst forecasts for the company.
What The Trend Of ROCE Can Tell Us
When we looked at the ROCE trend at Japan Foods Holding, we didn't gain much confidence. Over the last five years, returns on capital have decreased to 9.6% from 12% five years ago. However, given capital employed and revenue have both increased it appears that the business is currently pursuing growth, at the consequence of short term returns. And if the increased capital generates additional returns, the business, and thus shareholders, will benefit in the long run.
On a side note, Japan Foods Holding's current liabilities have increased over the last five years to 35% of total assets, effectively distorting the ROCE to some degree. If current liabilities hadn't increased as much as they did, the ROCE could actually be even lower. Keep an eye on this ratio, because the business could encounter some new risks if this metric gets too high.
The Bottom Line
In summary, despite lower returns in the short term, we're encouraged to see that Japan Foods Holding is reinvesting for growth and has higher sales as a result. These trends are starting to be recognized by investors since the stock has delivered a 26% gain to shareholders who've held over the last five years. Therefore we'd recommend looking further into this stock to confirm if it has the makings of a good investment.
One more thing: We've identified 4 warning signs with Japan Foods Holding (at least 1 which is potentially serious) , and understanding them would certainly be useful.
For those who like to invest in solid companies, check out this free list of companies with solid balance sheets and high returns on equity.
Have feedback on this article? Concerned about the content? Get in touch with us directly. Alternatively, email editorial-team (at) simplywallst.com.
This article by Simply Wall St is general in nature. We provide commentary based on historical data and analyst forecasts only using an unbiased methodology and our articles are not intended to be financial advice. It does not constitute a recommendation to buy or sell any stock, and does not take account of your objectives, or your financial situation. We aim to bring you long-term focused analysis driven by fundamental data. Note that our analysis may not factor in the latest price-sensitive company announcements or qualitative material. Simply Wall St has no position in any stocks mentioned.
Join A Paid User Research Session
You’ll receive a US$30 Amazon Gift card for 1 hour of your time while helping us build better investing tools for the individual investors like yourself. Sign up here
