
 Yahoo Finance
 Investors in Natural Health Trends (NASDAQ:NHTC) have unfortunately lost 67% over the last five years
We think intelligent long term investing is the way to go. But along the way some stocks are going to perform badly. Zooming in on an example, the Natural Health Trends Corp. (NASDAQ:NHTC) share price dropped 81% in the last half decade. We certainly feel for shareholders who bought near the top. Furthermore, it's down 27% in about a quarter. That's not much fun for holders. However, one could argue that the price has been influenced by the general market, which is down 15% in the same timeframe. While a drop like that is definitely a body blow, money isn't as important as health and happiness.
It's worthwhile assessing if the company's economics have been moving in lockstep with these underwhelming shareholder returns, or if there is some disparity between the two. So let's do just that.
View our latest analysis for Natural Health Trends
There is no denying that markets are sometimes efficient, but prices do not always reflect underlying business performance. One way to examine how market sentiment has changed over time is to look at the interaction between a company's share price and its earnings per share (EPS).
During the five years over which the share price declined, Natural Health Trends' earnings per share (EPS) dropped by 57% each year. The share price decline of 28% per year isn't as bad as the EPS decline. So investors might expect EPS to bounce back -- or they may have previously foreseen the EPS decline. With a P/E ratio of 73.30, it's fair to say the market sees a brighter future for the business.
You can see how EPS has changed over time in the image below (click on the chart to see the exact values).
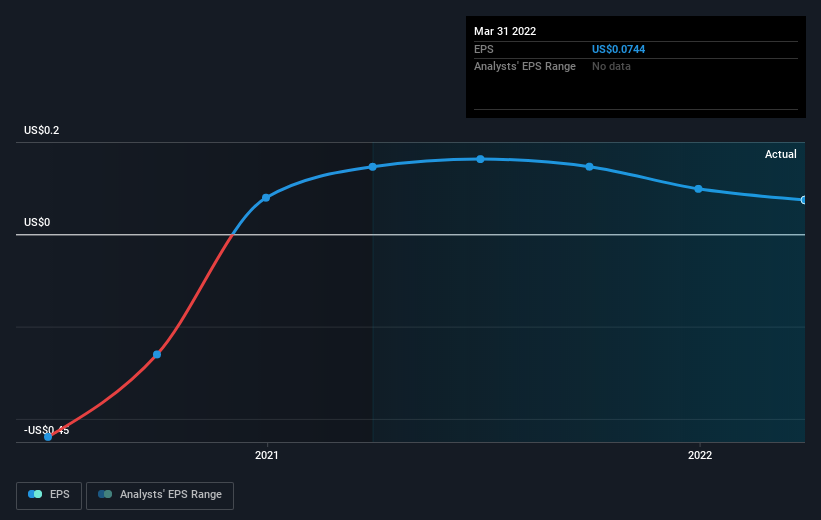
It might be well worthwhile taking a look at our free report on Natural Health Trends' earnings, revenue and cash flow.
What About Dividends?
When looking at investment returns, it is important to consider the difference between total shareholder return (TSR) and share price return. The TSR incorporates the value of any spin-offs or discounted capital raisings, along with any dividends, based on the assumption that the dividends are reinvested. It's fair to say that the TSR gives a more complete picture for stocks that pay a dividend. In the case of Natural Health Trends, it has a TSR of -67% for the last 5 years. That exceeds its share price return that we previously mentioned. And there's no prize for guessing that the dividend payments largely explain the divergence!
A Different Perspective
Although it hurts that Natural Health Trends returned a loss of 12% in the last twelve months, the broader market was actually worse, returning a loss of 17%. Of far more concern is the 11% p.a. loss served to shareholders over the last five years. While the losses are slowing we doubt many shareholders are happy with the stock. I find it very interesting to look at share price over the long term as a proxy for business performance. But to truly gain insight, we need to consider other information, too. Consider for instance, the ever-present spectre of investment risk. We've identified 6 warning signs with Natural Health Trends (at least 2 which don't sit too well with us) , and understanding them should be part of your investment process.
Of course, you might find a fantastic investment by looking elsewhere. So take a peek at this free list of companies we expect will grow earnings.
Please note, the market returns quoted in this article reflect the market weighted average returns of stocks that currently trade on US exchanges.
Have feedback on this article? Concerned about the content? Get in touch with us directly. Alternatively, email editorial-team (at) simplywallst.com.
This article by Simply Wall St is general in nature. We provide commentary based on historical data and analyst forecasts only using an unbiased methodology and our articles are not intended to be financial advice. It does not constitute a recommendation to buy or sell any stock, and does not take account of your objectives, or your financial situation. We aim to bring you long-term focused analysis driven by fundamental data. Note that our analysis may not factor in the latest price-sensitive company announcements or qualitative material. Simply Wall St has no position in any stocks mentioned.
