
 Yahoo Finance
 Is IperionX (ASX:IPX) In A Good Position To Deliver On Growth Plans?
We can readily understand why investors are attracted to unprofitable companies. For example, although Amazon.com made losses for many years after listing, if you had bought and held the shares since 1999, you would have made a fortune. But the harsh reality is that very many loss making companies burn through all their cash and go bankrupt.
Given this risk, we thought we'd take a look at whether IperionX (ASX:IPX) shareholders should be worried about its cash burn. In this report, we will consider the company's annual negative free cash flow, henceforth referring to it as the 'cash burn'. First, we'll determine its cash runway by comparing its cash burn with its cash reserves.
See our latest analysis for IperionX
How Long Is IperionX's Cash Runway?
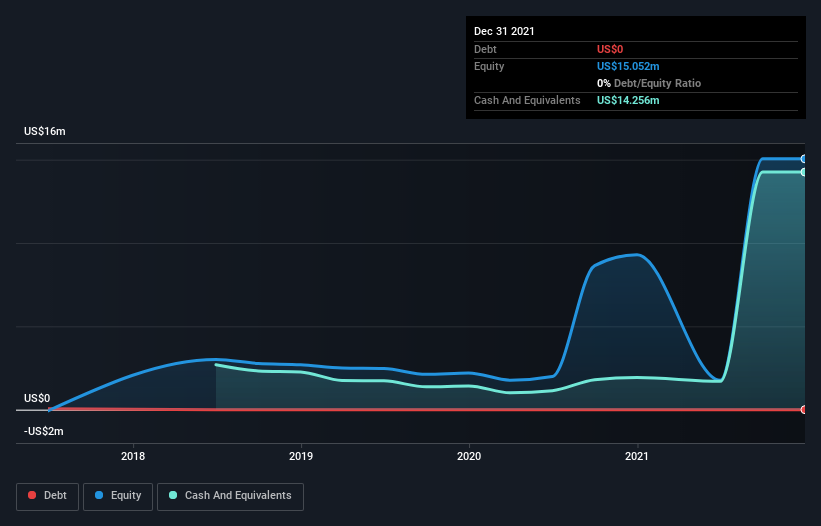
A cash runway is defined as the length of time it would take a company to run out of money if it kept spending at its current rate of cash burn. When IperionX last reported its balance sheet in December 2021, it had zero debt and cash worth US$14m. Looking at the last year, the company burnt through US$10m. That means it had a cash runway of around 16 months as of December 2021. While that cash runway isn't too concerning, sensible holders would be peering into the distance, and considering what happens if the company runs out of cash. You can see how its cash balance has changed over time in the image below.
How Is IperionX's Cash Burn Changing Over Time?
Because IperionX isn't currently generating revenue, we consider it an early-stage business. Nonetheless, we can still examine its cash burn trajectory as part of our assessment of its cash burn situation. Remarkably, it actually increased its cash burn by 1,187% in the last year. With that kind of spending growth its cash runway will shorten quickly, as it simultaneously uses its cash while increasing the burn rate. Admittedly, we're a bit cautious of IperionX due to its lack of significant operating revenues. So we'd generally prefer stocks from this list of stocks that have analysts forecasting growth.
How Easily Can IperionX Raise Cash?
Given its cash burn trajectory, IperionX shareholders may wish to consider how easily it could raise more cash, despite its solid cash runway. Generally speaking, a listed business can raise new cash through issuing shares or taking on debt. One of the main advantages held by publicly listed companies is that they can sell shares to investors to raise cash and fund growth. By comparing a company's annual cash burn to its total market capitalisation, we can estimate roughly how many shares it would have to issue in order to run the company for another year (at the same burn rate).
IperionX's cash burn of US$10m is about 15% of its US$70m market capitalisation. Given that situation, it's fair to say the company wouldn't have much trouble raising more cash for growth, but shareholders would be somewhat diluted.
So, Should We Worry About IperionX's Cash Burn?
Even though its increasing cash burn makes us a little nervous, we are compelled to mention that we thought IperionX's cash burn relative to its market cap was relatively promising. We don't think its cash burn is particularly problematic, but after considering the range of factors in this article, we do think shareholders should be monitoring how it changes over time. Taking a deeper dive, we've spotted 6 warning signs for IperionX you should be aware of, and 3 of them shouldn't be ignored.
Of course, you might find a fantastic investment by looking elsewhere. So take a peek at this free list of interesting companies, and this list of stocks growth stocks (according to analyst forecasts)
Have feedback on this article? Concerned about the content? Get in touch with us directly. Alternatively, email editorial-team (at) simplywallst.com.
This article by Simply Wall St is general in nature. We provide commentary based on historical data and analyst forecasts only using an unbiased methodology and our articles are not intended to be financial advice. It does not constitute a recommendation to buy or sell any stock, and does not take account of your objectives, or your financial situation. We aim to bring you long-term focused analysis driven by fundamental data. Note that our analysis may not factor in the latest price-sensitive company announcements or qualitative material. Simply Wall St has no position in any stocks mentioned.
